I am moving my blogg to : besimondata.com and I hope you will follow me there as well.
See you there!
Besim

Data Science blog
Viser innlegg med etiketten big data. Vis alle innlegg
Viser innlegg med etiketten big data. Vis alle innlegg
fredag 20. januar 2017

mandag 19. desember 2016
Modernizing data description
Illumination
In the recent times, few words (like Robotics, Artificial Intelligence, Analytics, Data Mining, Machine Learning, etc.) are powerful (sometime confusing) in IT industry.
In this competitive world, it is highly important for any software engineer to understand the concepts and usage of the emerging fields. Itz essential to survive in the rapid growth IT industry.
Based on my (l)earning through the premium technology institute and related work experience, I'm writing this article with the strong fundamentals and concepts around it.
Key Areas
In my view, these emerging fields are categorized into 4 key areas. Letz see them in details:
1. Statistics
We all know that Statistics is a study of how to collect, organizes, analyze, and interpret numerical information from data. Statistics can slip into two taxonomy namely:
1. Descriptive Statistics
2. Inferential Statistics
Descriptive statistics involves method of organizing, summering and picturing information from data. Familiar examples are Tables, Graphs, Averages. Descriptive statistics usually involve measures of central tendency (mean, median, mode) and measures of dispersion (variance, standard deviation, etc.)
Inferential statistics invokes method of using information from sample to draw conclusion about the population. Common terminologies are "Margin of error", "Statically Significant".
2. Artificial Intelligence (AI)
AI is a broad term referring to computers and systems that are capable of essentially coming up with solutions to problems on their own. The solutions aren’t hard-coded into the program; instead, the information needed to get to the solution is coded and AI (used often in medical diagnostics) uses the data and calculations to come up with a solution on its own.
 As depicted above, AI is the super set of the listed components and so itz a vast area to explore.
3. Machine Learning (ML)
Machine learning is capable of generalizing information from large data sets, and then detects and extrapolates patterns in order to apply that information to new solutions and actions. Obviously, certain parameters must be set up at the beginning of the machine learning process so that the machine is able to find, assess, and act upon new data

4. Data Mining
Data mining is an integral part of coding programs with the information, statistics, and data necessary for AI to create a solution

In the traditional reporting model, the data source is retrospective to look back and examines the exposure of the existing information. Descriptive analytics are useful because they allow us to learn from past behaviors, and understand how they might influence future outcomes.
Inter Connectivity
On connecting the dots of the above said 4 platforms, Artificial Intelligence is the foundation which is followed by Machine Learning, Statistics and Data Mining, chronologically. In simple term, AI (Artificial Intelligence) is the super set of all paradigm.

Artificial Intelligence is a science to develop a system or software to mimic human to respond and behave in a circumference.
Evolution of Statistics, AI, ML and Data Mining is depicted in the below chart.

Need of Chat Bot
On analyzing where people really spend time, you’ll probably get the details where the users are. Chat Bot is the low hanging fruit in terms of business & technical opportunity.
A Chat Bot can be easily built into any major commonly used chat product like Facebook Messenger or Slack. Latest industry data indicates that the end users reached more usage band of messenger apps than social networks, as depicted below:

We've another dimension of Messenger App usage. According to Statista, most popular global mobile messenger apps usage is pointed below, as of April 2016. Itz based on number of monthly active users (in millions).

Next Gen - Messaging
If you think about your daily interactions online, it won’t be that surprising – you use Slack or Skype to communicate with your colleagues at work, you talk to your closest friends on Facebook in Messenger, you probably have several chats with different groups of your friends depending on interests etc.

Chat Bots shift the shopping experience from browsing (web/retail stores) to recommendation. Bots learn about you, much like a trusted friend or personal shopper.
Chat Bot in Business
In Artificial Intelligence, Chat Bot plays a key tool by providing feedback to users on purchases with customer service agents on hand to provide further assistance.
In China, not only is WeChat used by close to two thirds of 16-24 year-old online consumers, but the service has capitalized on its massive market share by offering functionality well beyond simple messaging by attempting to insert itself into as many stations along the purchase journey as possible.
As the major part of digital consumers’ purchase journeys and online lives, Chat Bot will need to be non-intrusive, obviously beneficial to the user and, perhaps most importantly, present themselves as an honest assistant, not an advertisement in disguise.
As the summation of my analysis, 2 key business benefits of Chat Bot usage:
1. High automation in manual contact center business; leads to drastic cost reduction
2. Continuous improvement (on usage) is possible with the usage of Machine Learning in AI intelligent Chat Bot
Conclusion
What you research today may eventually underpin how you deploy a successful Chat Bot application for your business sooner rather than later once all the kinks get worked out. Get ready, folks !!
søndag 11. desember 2016
Personal Finance Application
Make Personal Finance fun again by automated segmentations, benchmarking gamification and automated machine learning budgeting tool.
ELA AS is newly founded startup with a clear mission to make use of data to benefit humanity. #DataForGood is our core value and a hashtag of our activities in social media. We have started with four projects, but we hope to continue with some more:
1. Personal Finance Digital Assistant which is an add-on solution to your digital bank account that gives you better picture of personal finances based on bench-marking against predefined data set of your segmentation (ex: income range, family members, region you live etc.) and fully automatized data input for all segments: cost, income and balance. This will include a machine learning (ML) algorithm that will suggest you the best way to save and invest money, how to overcome a financial difficulty and how to perform in budgeting your economy the best way.
We will soon be in Kickstarter and I hope that you will support our project!
The Deception of Supervised Learning
Do models or offline datasets ever really tell us what to do? Most application of supervised learning is predicated on this deception.

Imagine you're a doctor tasked with choosing a cancer therapy. Or a Netflix exec tasked with recommending movies. You have a choice. You could think hard about the problem and come up with some rules. But these rules would be overly simplistic, not personalized to the patient or customer. Alternatively, you could let the data decide what to do!
The ability to programmatically make intelligent decisions by learning complex decision rules from big data is a primary selling point of machine learning. Leaps forward in the predictive accuracy of supervised learning techniques, especially deep learning, now yield classifiers that outperform human predictive accuracy on many tasks. We can guess how an individual will rate a movie, classify images, or recognize speech with jaw-dropping accuracy. So why not make our services smart by letting the data tell us what to do?
Here's the rub.
While the supervised paradigm is but one of several in the machine learning canon, nearly all machine learning deployed in the real world amounts to supervised learning. And supervised learning methods doesn't tell us to doanything. That is, the theory and conception of supervised learning addresses pattern recognition but disregards the notion of interaction with an environment altogether.
[Quick crash course: in supervised learning, we collect a dataset of input-output (X,Y) pairs. The learning algorithm then uses this data to train a model. This model is simply a mapping from inputs to outputs. Now given a new input (such as a [drug,patient] pair), we can predict a likely output (say, 5-year survival). We determine the quality of the model by assessing its performance (say error rate or mean squared error) on hold-out data.]

Now suppose we train a model to predict 5-year survival given some features of the patient and the assigned treatment protocol. The survival model that we train doesn't know why drug A was prescribed to some patients and not others. And it has no way of knowing what will happen when you apply drug A to patients who previously wouldn't have received it. That's because supervised learning relies on the i.i.d. assumption. In short, this means that we expect the future data to be distributed identically like the past. With respect to temporal effects, we assume is that the distribution of data is stationary. But when we introduce a decision protocol based on a machine learning model to the world, we change the world, violating our assumptions. We alter the distribution of future data and thus should expect to invalidate our entire model.
For some tasks, like speech recognition, these concerns seem remote. Use of a voice transcription tool might not, in the short run, change how we speak. But in more dynamic decision-making contexts, the concerns should be paramount. For example, Rich Caruana of Microsoft Research showed a real-life model trained to predict risk of death for pneumonia patients. Presumably this information could be used to aid in triage. The model however, showed that asthma was predictive of lower risk. This was a true correlation in the data, but it owed to the more aggressive treatment such co-morbid patients received. Put simply, a researcher taking actions based on this information would be mistaking correlation for causation. And if a hospital used the risk score for triage, they would actually recklessly put the asthma patients at risk, thus invalidating the learned model model.
Supervised models can't tell us what to do because they fundamentally ignore the entire idea of an action. So what do people mean when they say that they act based on a model? Or when they say that the model (or the data) tells them what to do? How is Facebook's newsfeed algorithm curating stories? How is Netflix's recommender system curating movies?
Usually this means that we strap on some ad-hoc decision protocol to a predictive model. Say we have a model that takes a patient and a drug and predicts the probability of survival. A typical ad hoc rule might say that we should give the drug that maximizes the predicted probability of survival.

But this classifier is contingent on the historical standard of care. For one drug, a model might predict better outcomes because the drug truly causes better outcomes. But for others causality might be reversed, or the association might owe to unobserved factors. These kinds of actions encode ungrounded assumptions mistaking correlative association for causal relationships. While oncologists are not so reckless as to employ this reasoning willy-nilly, it's precisely the logic that underlies less consequential recommender systems all over the internet. Netflix doesn't account for how its recommendations influence your viewing habits, and Facebook's algorithms likely don't account for the effects of curation on reader behavior.
The failure to account for causality or interaction with the environment are but two among many deceptions underlying the modern use of supervised learning. Other, less fundamental, issues abound. For example, we often optimize surrogate objectives that only faintly resemble our true objectives. Search engines assume that mouse clicks indicate accurately answered queries. This means that when, in a momentary lapse of spine, you click on a celebrity break-up story after searching for an egg-salad recipe, the model registers a job a well done.
Some other issues to heap on the laundry list of common deceptions:
- Disregarding real-life cost-sensitivity
- Erroneous interpretation of predicted probabilities as quantifications of uncertainty
- Ignoring differences between constructed training sets and real world data
The overarching point here is that problem formulation for most machine learning systems can be badly mismatched against the real-world problems we're trying to solve. As detailed in my recent paper, The Mythos of Model Interpretability, it's this mismatch that leads people to wonder whether they can "trust" machine learning models.
Some machine learners suggest that the desire for an interpretation will pass - that it reflects an unease which will abate if the models are "good enough". But good enough at what? Minimizing cross-entropy loss on a surrogate task on a toy-dataset in a model that fundamentally ignores the decision-making process for which a model will be deployed? The suggestion is naive, but understandable. It reflects the years that many machine learners have spent single-mindedly focused on isolated tasks like image recognition. This focus was reasonable because these offline tasks were fundamental obstacles themselves, even absent the complication of reality. But as a result, reality is a relatively new concept to a machine learning community that increasingly rubs up against it.
So where do we go from here?
Model Interpretability
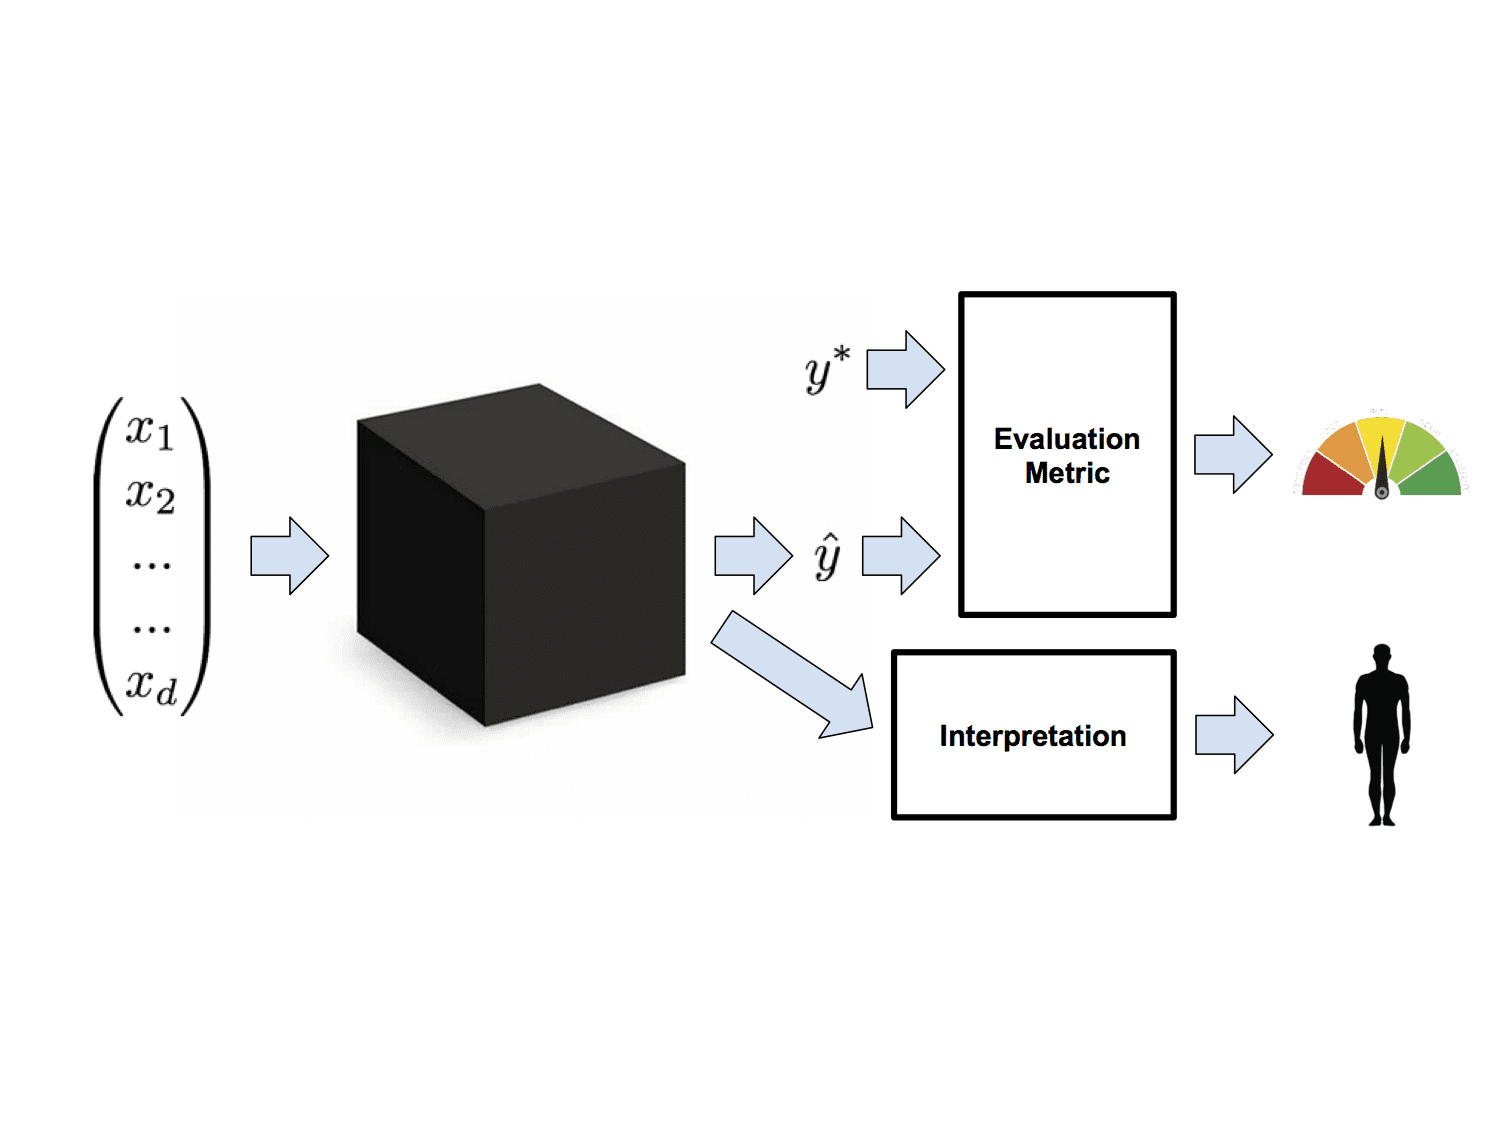
One solution is to go ahead and throw caution to the wind but then to interrogate the models to see if they're behaving acceptably. These efforts seek to interpret models to mitigate the mismatch between real and optimized objectives. The idea behind most work in interpretability is that in addition to the predictions required by our evaluation metrics, models should yield some additional information, which we term an interpretation. Interpretations can come in many varieties, notably transparency and post-hoc interpretability. The idea behind transparency is that we can introspect the model and determine precisely what it's doing. Unfortunately, the most useful models aren't especially transparent. Post-hoc interpretations, on the other hand, address techniques to extract explanations, even those from models we can't quite introspect. In the Mythos paper (https://arxiv.org/abs/1606.03490), I offer a broad taxonomy of both the objectives and techniques for interpreting supervised models.
Upgrade to More Sophisticated Paradigms of Learning
Another solution might be to close the gap between the real and modeled objectives. Some problems, like cost sensitivity, can be addressed within the supervised learning paradigm. Others, like causality, might require us to pursue fundamentally more powerful models of learning. Reinforcement learning (RL), for example, directly models an agent acting within a sequential decision making process. The framework captures the causal effects of taking actions and accounts for a distribution of data that changes per modifications to the policy. Unfortunately, practical RL techniques for sequential decision-making have only been reduced to practice on toy problems with relatively small action-spaces. Notable advances include Google Deepmind's Atari and Go-playing agents.
Several papers by groups including Steve Young's lab at Cambridge (paper), the research team at Montreal startup Maluuba (arxiv.org/abs/1606.03152), and my own work with Microsoft Research's Deep Learning team (arxiv.org/abs/1608.05081), seek to extend this progress into the more practically useful realm of dialogue systems.
Using RL in critical settings like medical care poses its own thorny set of problems. For example, RL agents typically learn by exploration. You could think of exploration as running an experiment. Just like a doctor might run a randomized trial, the RL agent periodically takes randomized actions, using the information gained to guide continued improvement of its policy. But when is it OK to run experiments with human subjects? To do any research on human subjects, even the most respected researchers are required to submit to an ethics board. Can we then turn relatively imbecilic agents loose to experiment on human subjects absent oversight?
Conclusions
Supervised learning is simultaneously unacceptable, inadequate, and yet, at present, the most powerful tool at our disposal. While it's only reasonable to pillory the paradigm with criticism, it remains nonetheless the most practically useful tool around. Nonetheless I'd propose the following takeaways:- We should aspire to unseat the primacy of strictly supervised solutions. Improvements in reinforcement learning offer a promising alternative.
- Even within the supervised learning paradigm, we should work harder to eliminate those flaws of problem formulation that are avoidable.
- We should remain suspicious of the behavior of live systems, and devise mechanisms to both understand them and provide guard-rails to protect against unacceptable outcomes.
 Zachary Chase Lipton is a PhD student in the Computer Science Engineering department at the University of California, San Diego. He is interested in both theoretical foundations and applications of machine learning. In addition to his work at UCSD, he has interned at Microsoft Research Labs and as a Machine Learning Scientist at Amazon, and is a Contributing Editor at KDnuggets.
Related:
- The Hard Problems AI Can’t (Yet) Touch
- Does Deep Learning Come from the Devil?
- MetaMind Competes with IBM Watson Analytics and Microsoft Azure Machine Learning
- Deep Learning and the Triumph of Empiricism
- The Myth of Model Interpretability
- (Deep Learning’s Deep Flaws)’s Deep Flaws
- Data Science’s Most Used, Confused, and Abused Jargon
søndag 27. november 2016
The company that perfects Data Visualization in Virtual Reality will be the next Unicorn
Fortune 500 companies are investing staggering amounts into data visualization. Many have opted for Tableau, Qlik, MicroStrategy, etc. but some have created their own in HTML5, full stack JavaScript, Python, and R. Leading CIOs and CTOs are obsessed with being the first adopters in whatever is next in data visualization.
The next frontier in data visualization is clearly immersive experiences. The 2014 paper "Immersive and Collaborative Data Visualization Using Virtual Reality Platforms" written by CalTech astronomers is a staggeringly large step in the right direction. In fact, I am shocked that 1 year later I have not seen a commercial application of this technology. You can read it here: http://arxiv.org/ftp/arxiv/papers/1410/1410.7670.pdf
The key theme that I hear at technology conferences lately is the need to focus on analytics, visualization and data exploration. The advent of big data systems such as Hadoop and Spark has made it.

Picture Source: VR 2015 IEEE Virtual Reality International Conference
possible - for the first time ever - to store Petabytes of data on commodity hardware and process this data, as needed, in a fault tolerant and incredibly quick fashion. Many of us fail to understand the full implications of this inflection point in the history of computing.
Storage is decreasing in cost every year, to the point where you can now have multiple GB on a USB drive that 10 years ago you could only store a few MBs. Gigabit internet is being installed in cities all over the world. Spark uses the concept of in memory distributed computation to perform at 10X map reduce for gigantic datasets and is already being used in production by Fortune 50 companies. Tableau, Qlik, MicroStrategy, Domo, etc. have gained tremendous market share as companies that have implemented Hadoop components such as HDFS, Hbase, Hive, Pig, and Map Reduce are starting to wonder "How I can I visualize that data?"
Now think about VR - probably the hottest field in technology at this moment. It has been more than a year since Facebook bought Oculus for 2Billion and we have seen Google Cardboard burst onto the scene. Applications from media companies like the NY Times are already becoming part of our every day lives. This month at the CES show in Las Vegas, dozens of companies were showcasing virtual reality platforms that improve on the state of the art and allow for a motion-sickness free immersive experience.
All of this combines into my primary hypothesis - this is a great time to start a company that would provide the capability for immersive data visualization environments to businesses and consumers. I personally believe that businesses and government agencies would be the first to fully engage in this space on the data side, but there is clearly an opportunity in gaming on the consumer side.
Personally, I have been so taken by the potential of this idea that I wrote a post in this blog about the “feeling” of being in one of these immersive VR worlds.
http://sarcastech.tumblr.com/post/136459105843/data-art-an-immersive-virtual-reality-journey
The post describes what it would be like to experience data with not only vision, but touch and sound and even smell.
Just think about the possibilities of examining streaming data sets, that currently are being analyzed with tools such as Storm, Kafka, Flink, and Spark Streaming as a river flowing under you!
The strength of the water can describe the speed of the data intake, or any other variable that is represented by a flow - stock market prices come to mind.
The possibilities for immersive data experiences are absolutely astonishing. The CalTech astronomers have already taken the first step in that direction, and perhaps there is a company out there that is already taking the next step. That being said, if this sounds like an exciting venture to you, DM me on twitter @beskotw and we can talk.
The next frontier in data visualization is clearly immersive experiences. The 2014 paper "Immersive and Collaborative Data Visualization Using Virtual Reality Platforms" written by CalTech astronomers is a staggeringly large step in the right direction. In fact, I am shocked that 1 year later I have not seen a commercial application of this technology. You can read it here: http://arxiv.org/ftp/arxiv/papers/1410/1410.7670.pdf
The key theme that I hear at technology conferences lately is the need to focus on analytics, visualization and data exploration. The advent of big data systems such as Hadoop and Spark has made it.

Picture Source: VR 2015 IEEE Virtual Reality International Conference
possible - for the first time ever - to store Petabytes of data on commodity hardware and process this data, as needed, in a fault tolerant and incredibly quick fashion. Many of us fail to understand the full implications of this inflection point in the history of computing.
Storage is decreasing in cost every year, to the point where you can now have multiple GB on a USB drive that 10 years ago you could only store a few MBs. Gigabit internet is being installed in cities all over the world. Spark uses the concept of in memory distributed computation to perform at 10X map reduce for gigantic datasets and is already being used in production by Fortune 50 companies. Tableau, Qlik, MicroStrategy, Domo, etc. have gained tremendous market share as companies that have implemented Hadoop components such as HDFS, Hbase, Hive, Pig, and Map Reduce are starting to wonder "How I can I visualize that data?"
Now think about VR - probably the hottest field in technology at this moment. It has been more than a year since Facebook bought Oculus for 2Billion and we have seen Google Cardboard burst onto the scene. Applications from media companies like the NY Times are already becoming part of our every day lives. This month at the CES show in Las Vegas, dozens of companies were showcasing virtual reality platforms that improve on the state of the art and allow for a motion-sickness free immersive experience.
All of this combines into my primary hypothesis - this is a great time to start a company that would provide the capability for immersive data visualization environments to businesses and consumers. I personally believe that businesses and government agencies would be the first to fully engage in this space on the data side, but there is clearly an opportunity in gaming on the consumer side.
Personally, I have been so taken by the potential of this idea that I wrote a post in this blog about the “feeling” of being in one of these immersive VR worlds.
http://sarcastech.tumblr.com/post/136459105843/data-art-an-immersive-virtual-reality-journey
The post describes what it would be like to experience data with not only vision, but touch and sound and even smell.
Just think about the possibilities of examining streaming data sets, that currently are being analyzed with tools such as Storm, Kafka, Flink, and Spark Streaming as a river flowing under you!
The strength of the water can describe the speed of the data intake, or any other variable that is represented by a flow - stock market prices come to mind.
The possibilities for immersive data experiences are absolutely astonishing. The CalTech astronomers have already taken the first step in that direction, and perhaps there is a company out there that is already taking the next step. That being said, if this sounds like an exciting venture to you, DM me on twitter @beskotw and we can talk.
onsdag 24. august 2016
Laptop for data science
What are the laptops which are most suited for data scientists and analysts?
As we deal with heavy computations and also need to generate visualizations, something which can take the toll of it, would be recommended.
Would be preferred if it can help in handling Big Data analytics too.
Even though the analytics is done in the Map Reduce framework (or distributed computing), yet the computations are heavy and time taking and also slows down the laptop in most cases.
So, a laptop with features and OS which is most suited to handle such things gracefully is recommended.
[Price not an issue]
As I am pretty much in the same situation, here are what I look for:
SSD: since you'll likely perform many I/O on large data sets. 1 TB is my bottom line.
RAM: since it's often more convenient and much faster to keep data sets (or part of it) in memory. 16 GB is really bottom line.
GPU: Nvidia is sometimes preferable over AMD as it tends to be more supported (e.g. for neural network libraries). I had to get a MBP M2014 instead of M2015 because the latter had AMD while the former has Nvidia, and I need to use Theano.
OS: Linux tend to have more libraries (but since it doesn't have any decent speech engine software I personally use Microsoft Windows, using Linux in VM or in server).
CPU: hasn't evolved much over the last few years... some i7 3rd or 4th generation is standard.
As it's often cheaper to add SSD and RAM oneself, I tend upgrade mid-spec laptops.
If price isn't an issue, you can have a look at those overpriced Alienwares. For people who are more budget conscious, just check to what extend the laptop is upgradable (e.g. max RAM + number of SSD slots). In the US, I like Xotic PC as the max specs are clearly defined.
torsdag 11. august 2016
Last day(s) to participate for a chance to win a FREE space at our Data Science Boot Camp
A free place on our pioneering Data Science Boot Camp training programme is being offered by specialist recruitment agency, MBN Solutions. Places on the much-anticipated course, aimed at upskilling those with raw analytical grounding into bona fide data scientists, are worth £7,000. The average cost of recruiting a data science specialist is £15,000.
The Data Lab has partnered with New York’s globally renowned, The Data Incubator (whose courses are reputedly harder to get into than Harvard), to develop the three-week data Boot Camp as part of a drive to plug the nation’s data skills gap. It is aimed at helping to unlock the economic potential of data to Scotland, estimated to be worth £17 billion* in Scotland alone.
To apply for the MBN Solutions sponsored place, potential participants need to submit a video explaining how they would use the data science Boot Camp training in their current organisations. The video should be maximum two minutes and include:
- Your current role and experience
- Why you want to take part in the course
- Why you believe improving your skills in data science is important
- How you hope to use the skills you will learn in the course to improve your work
- What impact do you expect to achieve for your organisation as a result of your skills
The video must be uploaded to YouTube, the link to the video sent to skills@thedatalab.com by 12th August.
Michael Young, CEO of MBN Solutions, said: “With the average cost of recruiting a data scientist £15,000, the Boot Camp presents an incredible opportunity to upskill current staff and invest in your company’s data science offering.
“The Data Incubator is recognised as the go-to experts in the data training sector globally and, by sponsoring a place for a budding data scientist, we are helping to enhance Scotland’s pipeline of data science talent.
“Every day we see fantastic, innovative data science projects going on in our client’s organisations, Scotland is leading the way in data science in the UK and The Data Lab are really driving the data agenda forward. Some countries are only just waking up to the potential of data. This course marks a really exciting time for Scotland and The Data Lab and we at MBN Solutions are thrilled to be a part of it.”
Brian Hills, Head of Data at The Data Lab, said: “We’re very pleased to have MBN Solutions sponsor a place on the Boot Camp which will take us one step closer to exploiting the data opportunity in great demand and short supply.
“It is going to be an incredible three weeks with attendees gaining a highly sought after data science skillset and learnings from world-leaders in data science.
“It’s crucial Scotland remains ahead of the curve in data science. By investing in our pipeline of talent and learning from international experts, we are securing our future and taking critical steps toward exploiting the data potential available here in Scotland.”
The pioneering training initiative will allow Scottish businesses to fast track potential returns by using data analysis to drive insight and decision-making across industry. There are only a few places left for the Boot Camp which will take place in September in Edinburgh. It will focus on developing practical application skills such as advanced python, machine learning and data visualisation in a collaborative environment.
For further information on the Boot Camp, how to apply, and how to enter the competition, please check out our Boot camp page, download our brochure or email skills@thedatalab.com
About The Data Incubator
The Data Incubator is data science education company based in NYC, DC, and SF with both corporate training and hiring offerings. They leverage real world business cases to offer customized, in-house training solutions in data and analytics. They also offer partners the opportunity to hire from their 8 week fellowship training PhDs to become data scientists. The fellowship selects 2% of its 2000+ quarterly applicants and is free for fellows. Hiring companies (including EBay, Capital One, AIG, and Genentech) pay a recruiting fee only if they successfully hire. You can read more about The Data Incubator on Harvard Business Review, VentureBeat, or The Next Web, or read about their alumni at Palantir or the NYTimes.
About MBN Solutions
In a field saturated by many lookalike recruitment consultancies, MBN is a truly different business. Priding ourselves on values of deep, real subject matter knowledge in the Data Science, Big Data, Analytics and Technology space, a passionate approach to developing our own consultants and a strategy placing our clients at the heart of our business, MBN are a true market defining ‘People Solutions’ business.
Another approach to Personal Finance
Re-Inventing Personal Finance using Data Science

Existing software and new approach
Big Data can help make it even better
Last technological findings can make this approach even more interesting and meaningful. Imagine what Big Data and Data Science can do by adding external data for customers that will allow opening of their social media accounts to the bank application. Social media behavior is very important and can bring very important segmentation inside customer categorizations.
Machine learning algorithms can help make the decision and budgeting much better based on other decisions and budgeting techniques.
Considerations
As I mentioned before, data impersonation and security are a showstopper as we are going to work with bench marking data sets that implies set of other customer’s data. Here we can have a potential data leak from one customer to another, so our system must ensure consistency in both sides and the bank system has everything under control. Transaction details of customers can make banks expose their ‘hidden’ costs and fees. Many banks will hesitate to offer this service to their customers just because of this; in other side customers have legitimate right to have such information.
Conclusion
Beneficiary to this approach are not only the customers and world economy, but also the bank itself in cases when they want to perform customer evaluation (credit check) and behave reaction to certain financial statuses. Today’s Credit scoring system lacks on better decisions because they miss important data.
I am on the way to build business concept and the technical architecture of this approach. My team and I would love to share this approach on details, including implementation, if any company, association or bank in the world is interested to offer this service to their customers. This can be the best preventive for World financial system to stay sustainable and not crush as it did before.
© Copyright All rights reserved to Besim Ismaili 03051982
Oslo, January 2015
Existing software and new approach
Usually existing Personal Finance applications are boring, because they are all dependent of manually input of your data, in right segment, the right amount, just boooring. In addition, you can count on manual input fails together with the impossibility of live update your financial status, to make it even worst experience. These and many other reasons make the existing Personal Finance applications nearly useless.
To avoid manual input of data into your application, you need a live feed from your transaction data (credit card usage, bank payments etc...) and only manual input for cash amounts. However, cash is very small problem, as we tend to avoid it as much as possible and instead we mostly buy with electrons.
Most of the banks offer to their customers a digital bank account where all the transactions are visible and that can the best source to avoid manual input. So, why we do not ask for built-inn application that will serve as Personal Financial app with even more possibilities to serve you.
The solution
This application can save lives, can make you better at your personal finance, can avoid financial crisis and help banks get better understanding of you as customer. It is not only you as a person that benefits, but the entire society and even the bank itself. Bank can have much better credit scoring for their customers and can avoid risky loans, risky bank interests for a particular customer etc…
To build (in) this app we need to consider many things and specially the approach that Business Intelligence solutions can serve to us, but keeping in mind security and impersonation as we work with very critical data.
Therefore, I am delighted to represent you PFI that stands for Personal Finance Intelligence, which represents a non-usual approach to Personal Finance solutions existing in market today.
Personal Finance Intelligence (PFI) aims to be a built-in Business Intelligence application inside your digital bank service to serve you as personal finance and budget planner assistant.
Inspired by a Norwegian TV Show “Luksusfellen”, this Business Intelligence app approach may be a solution for all these who fail to maintain well their own economy, and for those who want to perform their economy, save more and last but not least the bank itself.
The fundament of this concept is a Customer Analytics Data Center that would have the power process data on the transaction level. The duty of the data center will be to collect, structure, clean, model and present the data to the bank customers as usual Personal Finance application do, but in addition, data will be updated automatically. This is the reporting (presentation) layer of your financial status (picture), but this application can offer you much more and here is why!
In addition to a standard PF application, this solution include also bench-marking against an standardized customer (Ola Norman) that represent the data set of Min, Max or Average segmented by customer's choice and properties, for example: How I stand against customers from 28-35 years old, from east Oslo, in buying food and beverage this month?
To have more control and plan well your own economy, targeting will be an integrated service inside application where users (bank customers) can put their targets (manually) for costs or income or can leave the application algorithm fill that with projection based on each customer historical data. You can activate a flagging service, so you are warned when approaching certain limits in your expenses and run algorithm to optimize the use of remaining budget and you do not get broke.
To avoid manual input of data into your application, you need a live feed from your transaction data (credit card usage, bank payments etc...) and only manual input for cash amounts. However, cash is very small problem, as we tend to avoid it as much as possible and instead we mostly buy with electrons.
Most of the banks offer to their customers a digital bank account where all the transactions are visible and that can the best source to avoid manual input. So, why we do not ask for built-inn application that will serve as Personal Financial app with even more possibilities to serve you.
The solution
This application can save lives, can make you better at your personal finance, can avoid financial crisis and help banks get better understanding of you as customer. It is not only you as a person that benefits, but the entire society and even the bank itself. Bank can have much better credit scoring for their customers and can avoid risky loans, risky bank interests for a particular customer etc…
To build (in) this app we need to consider many things and specially the approach that Business Intelligence solutions can serve to us, but keeping in mind security and impersonation as we work with very critical data.
Therefore, I am delighted to represent you PFI that stands for Personal Finance Intelligence, which represents a non-usual approach to Personal Finance solutions existing in market today.
Personal Finance Intelligence (PFI) aims to be a built-in Business Intelligence application inside your digital bank service to serve you as personal finance and budget planner assistant.
Inspired by a Norwegian TV Show “Luksusfellen”, this Business Intelligence app approach may be a solution for all these who fail to maintain well their own economy, and for those who want to perform their economy, save more and last but not least the bank itself.
The fundament of this concept is a Customer Analytics Data Center that would have the power process data on the transaction level. The duty of the data center will be to collect, structure, clean, model and present the data to the bank customers as usual Personal Finance application do, but in addition, data will be updated automatically. This is the reporting (presentation) layer of your financial status (picture), but this application can offer you much more and here is why!
In addition to a standard PF application, this solution include also bench-marking against an standardized customer (Ola Norman) that represent the data set of Min, Max or Average segmented by customer's choice and properties, for example: How I stand against customers from 28-35 years old, from east Oslo, in buying food and beverage this month?
To have more control and plan well your own economy, targeting will be an integrated service inside application where users (bank customers) can put their targets (manually) for costs or income or can leave the application algorithm fill that with projection based on each customer historical data. You can activate a flagging service, so you are warned when approaching certain limits in your expenses and run algorithm to optimize the use of remaining budget and you do not get broke.
Big Data can help make it even better
Last technological findings can make this approach even more interesting and meaningful. Imagine what Big Data and Data Science can do by adding external data for customers that will allow opening of their social media accounts to the bank application. Social media behavior is very important and can bring very important segmentation inside customer categorizations.
Machine learning algorithms can help make the decision and budgeting much better based on other decisions and budgeting techniques.
Considerations
As I mentioned before, data impersonation and security are a showstopper as we are going to work with bench marking data sets that implies set of other customer’s data. Here we can have a potential data leak from one customer to another, so our system must ensure consistency in both sides and the bank system has everything under control. Transaction details of customers can make banks expose their ‘hidden’ costs and fees. Many banks will hesitate to offer this service to their customers just because of this; in other side customers have legitimate right to have such information.
Conclusion
Beneficiary to this approach are not only the customers and world economy, but also the bank itself in cases when they want to perform customer evaluation (credit check) and behave reaction to certain financial statuses. Today’s Credit scoring system lacks on better decisions because they miss important data.
I am on the way to build business concept and the technical architecture of this approach. My team and I would love to share this approach on details, including implementation, if any company, association or bank in the world is interested to offer this service to their customers. This can be the best preventive for World financial system to stay sustainable and not crush as it did before.
© Copyright All rights reserved to Besim Ismaili 03051982
Oslo, January 2015
lørdag 6. august 2016
Training in Critical Thinking & Descriptive Intelligence Analysis
Level 1 Intelligence Analyst Certification
About This Course
Course Description
The views expressed in this course are the instructor's alone and do not reflect the official position of the U.S. Government, the Intelligence Community, or the Department of Defense.
Although anyone can claim the title of “intelligence analyst,” there are currently few commonly understood, standardized certifications available to confirm analytic skill and proficiency. Some may argue that each analytic assessment should be judged on its content and not on the certification or reputation of the author. However, an analytic product can often read well even though its analytic underpinnings are flawed. Also, it would be beneficial to have some objective measure of an analyst’s skill before selecting him for a task, rather than to discover afterwards that the analyst was unable to meet the task. Having addressed why certifications are needed and assuming certifications would provide a worthwhile benefit, the discussion then turns to how and in what areas should one attain certification. Through an analysis of the concept of analysis, the author proposes that three basic divisions should be created to train and certify one as either a descriptive, explanative, or predictive analyst. This course provides level 1 certification as a descriptive intelligence analyst.
What are the requirements?
No prior preparation is necessary; however, a strong academic background, understanding of the scientific method, and an open mind will help the student perform well in this course.
What am I going to get from this course?
Apply critical thinking skills throughout the analytic process
Identify and mitigate biases to reveal unstated assumptions
Refine and clarify intelligence questions
Conduct research to identify existing data and gather new evidence
Select and apply appropriate analytic techniques
Reevaluate and revalidate previous analytic conclusions.Full details
What is the target audience?
This course is intended for the new intelligence analyst who has little to no prior experience. This course will provide the basic analytic skills necessary to produce basic, logically sound, descriptive intelligence analysis.
More experienced intelligence analysts will also find this course provides great "back to basics" refresher training.
Full details
Curriculum
Section 1: Introduction
Lecture 1
Welcome and overview 05:02
Lecture 2
The need for intelligence analyst certifications Article
Lecture 3
Course administration and supplemental material 02:45
Section 2: Critical Thinking and Avoiding Bias
Lecture 4
Thinking about thinking I; critical thinking 16:31
Quiz 1
Critical thinking quiz 5 questions
Lecture 5
Thinking about thinking II; logical, probable, and plausible reasoning 06:42
Lecture 6
Analytic pitfalls 14:19
Lecture 7
Insights into problem solving 15:34
Quiz 2
Section review quiz 5 questions
Section 3: Getting the Question Right
Lecture 8
Problem restatement 06:23
Quiz 3
Section review quiz 5 questions
Section 4: Intelligence Research and Collection
Lecture 9
Gathering the evidence 08:42
Lecture 10
Evaluating the evidence 08:40
Quiz 4
Section review quiz 5 questions
Section 5: Intelligence Analysis
Lecture 11
Selecting the right technique 03:03
Lecture 12
Realizing the power of analytics: arming the human mind Article
Lecture 13
Sorting, chronologies, and timelines 05:43
Lecture 14
The matrix 06:25
Lecture 15
Decision/event trees 07:57
Lecture 16
Link analysis 03:23
Lecture 17
Analysis of competing hypothesis (ACH) 16:27
Section 6: Conclusion
Lecture 18
Argument evaluation and reevaluation 10:30
Quiz 5
Final certification exam 25 questions
Lecture 19
Bonus Lecture Article
Follow the LINK: https://www.udemy.com/level-1-intelligence-analyst-certification/
tirsdag 26. juli 2016
Approaching (Almost) Any Machine Learning Problem
An average data scientist deals with loads of data daily. Some say over 60-70% time is spent in data cleaning, munging and bringing data to a suitable format such that machine learning models can be applied on that data. This post focuses on the second part, i.e., applying machine learning models, including the pre-processing steps. The pipelines discussed in this post come as a result of over a hundred machine learning competitions that I’ve taken part in. It must be noted that the discussion here is very general but very useful and there can also be very complicated methods which exist and are practiced by professionals.
We will be using python!
We will be using python!
Data
Before applying the machine learning models, the data must be converted to a tabular form. This whole process is the most time consuming and difficult process and is depicted in the figure below.

The machine learning models are then applied to the tabular data. Tabular data is most common way of representing data in machine learning or data mining. We have a data table, rows with different samples of the data or X and labels, y. The labels can be single column or multi-column, depending on the type of problem. We will denote data by X and labels by y.
Single column, binary values (classification problem, one sample belongs to one class only and there are only two classes)
Single column, real values (regression problem, prediction of only one value)
Multiple column, binary values (classification problem, one sample belongs to one class, but there are more than two classes)
Multiple column, real values (regression problem, prediction of multiple values)
And multi label (classification problem, one sample can belong to several classes)
Evaluation Metrics
For any kind of machine learning problem, we must know how we are going to evaluate our results, or what the evaluation metric or objective is. For example in case of a skewed binary classification problem we generally choose area under the receiver operating characteristic curve (ROC AUC or simply AUC). In case of multi-label or multi-class classification problems, we generally choose categorical cross-entropy or multiclass log loss and mean squared error in case of regression problems.
I won’t go into details of the different evaluation metrics as we can have many different types, depending on the problem.
The Libraries
To start with the machine learning libraries, install the basic and most important ones first, for example, numpy and scipy.
To see and do operations on data: pandas (http://pandas.pydata.org/)
For all kinds of machine learning models: scikit-learn (http://scikit-learn.org/stable/)
The best gradient boosting library: xgboost (https://github.com/dmlc/xgboost)
For neural networks: keras (http://keras.io/)
For plotting data: matplotlib (http://matplotlib.org/)
To monitor progress: tqdm (https://pypi.python.org/pypi/tqdm)
I don’t use Anaconda (https://www.continuum.io/downloads). It’s easy and does everything for you, but I want more freedom. The choice is yours.
The Machine Learning Framework
In 2015, I came up with a framework for automatic machine learning which is still under development and will be released soon. For this post, the same framework will be the basis. The framework is shown in the figure below:

A FRAMEWORK FOR MACHINE LEARNING COMPETITIONS, AUTOML WORKSHOP, INTERNATIONAL CONFERENCE ON MACHINE LEARNING 2015.
In the framework shown above, the pink lines represent the most common paths followed. After we have extracted and reduced the data to a tabular format, we can go ahead with building machine learning models.
The very first step is identification of the problem. This can be done by looking at the labels. One must know if the problem is a binary classification, a multi-class or multi-label classification or a regression problem. After we have identified the problem, we split the data into two different parts, a training set and a validation set as depicted in the figure below.

The splitting of data into training and validation sets “must” be done according to labels. In case of any kind of classification problem, use stratified splitting. In python, you can do this using scikit-learn very easily.

In case of regression task, a simple K-Fold splitting should suffice. There are, however, some complex methods which tend to keep the distribution of labels same for both training and validation set and this is left as an exercise for the reader.

I have chosen the eval_size or the size of the validation set as 10% of the full data in the examples above, but one can choose this value according to the size of the data they have.
After the splitting of the data is done, leave this data out and don’t touch it. Any operations that are applied on training set must be saved and then applied to the validation set. Validation set, in any case, should not be joined with the training set. Doing so will result in very good evaluation scores and make the user happy but instead he/she will be building a useless model with very high overfitting.
Next step is identification of different variables in the data. There are usually three types of variables we deal with. Namely, numerical variables, categorical variables and variables with text inside them. Let’s take example of the popular Titanic dataset (https://www.kaggle.com/c/titanic/data).

Here, survival is the label. We have already separated labels from the training data in the previous step. Then, we have pclass, sex, embarked. These variables have different levels and thus they are categorical variables. Variables like age, sibsp, parch, etc are numerical variables. Name is a variable with text data but I don’t think it’s a useful variable to predict survival.
Separate out the numerical variables first. These variables don’t need any kind of processing and thus we can start applying normalization and machine learning models to these variables.
There are two ways in which we can handle categorical data:
Convert the categorical data to labels

Convert the labels to binary variables (one-hot encoding)

Please remember to convert categories to numbers first using LabelEncoder before applying OneHotEncoder on it.
Since, the Titanic data doesn’t have good example of text variables, let’s formulate a general rule on handling text variables. We can combine all the text variables into one and then use some algorithms which work on text data and convert it to numbers.
The text variables can be joined as follows:

We can then use CountVectorizer or TfidfVectorizer on it:

or,

The TfidfVectorizer performs better than the counts most of the time and I have seen that the following parameters for TfidfVectorizer work almost all the time.

If you are applying these vectorizers only on the training set, make sure to dump it to hard drive so that you can use it later on the validation set.

Next, we come to the stacker module. Stacker module is not a model stacker but a feature stacker. The different features after the processing steps described above can be combined using the stacker module.

You can horizontally stack all the features before putting them through further processing by using numpy hstack or sparse hstack depending on whether you have dense or sparse features.

And can also be achieved by FeatureUnion module in case there are other processing steps such as pca or feature selection (we will visit decomposition and feature selection later in this post).

Once, we have stacked the features together, we can start applying machine learning models. At this stage only models you should go for should be ensemble tree based models. These models include:
RandomForestClassifier
RandomForestRegressor
ExtraTreesClassifier
ExtraTreesRegressor
XGBClassifier
XGBRegressor
We cannot apply linear models to the above features since they are not normalized. To use linear models, one can use Normalizer or StandardScaler from scikit-learn.
These normalization methods work only on dense features and don’t give very good results if applied on sparse features. Yes, one can apply StandardScaler on sparse matrices without using the mean (parameter: with_mean=False).
If the above steps give a “good” model, we can go for optimization of hyperparameters and in case it doesn’t we can go for the following steps and improve our model.
The next steps include decomposition methods:

For the sake of simplicity, we will leave out LDA and QDA transformations. For high dimensional data, generally PCA is used decompose the data. For images start with 10-15 components and increase this number as long as the quality of result improves substantially. For other type of data, we select 50-60 components initially (we tend to avoid PCA as long as we can deal with the numerical data as it is).

For text data, after conversion of text to sparse matrix, go for Singular Value Decomposition (SVD). A variation of SVD called TruncatedSVD can be found in scikit-learn.

The number of SVD components that generally work for TF-IDF or counts are between 120-200. Any number above this might improve the performance but not substantially and comes at the cost of computing power.
After evaluating further performance of the models, we move to scaling of the datasets, so that we can evaluate linear models too. The normalized or scaled features can then be sent to the machine learning models or feature selection modules.

There are multiple ways in which feature selection can be achieved. One of the most common way is greedy feature selection (forward or backward). In greedy feature selection we choose one feature, train a model and evaluate the performance of the model on a fixed evaluation metric. We keep adding and removing features one-by-one and record performance of the model at every step. We then select the features which have the best evaluation score. One implementation of greedy feature selection with AUC as evaluation metric can be found here:https://github.com/abhishekkrthakur/greedyFeatureSelection. It must be noted that this implementation is not perfect and must be changed/modified according to the requirements.
Other faster methods of feature selection include selecting best features from a model. We can either look at coefficients of a logit model or we can train a random forest to select best features and then use them later with other machine learning models.

Remember to keep low number of estimators and minimal optimization of hyper parameters so that you don’t overfit.
The feature selection can also be achieved using Gradient Boosting Machines. It is good if we use xgboost instead of the implementation of GBM in scikit-learn since xgboost is much faster and more scalable.

We can also do feature selection of sparse datasets using RandomForestClassifier / RandomForestRegressor and xgboost.
Another popular method for feature selection from positive sparse datasets is chi-2 based feature selection and we also have that implemented in scikit-learn.

Here, we use chi2 in conjunction with SelectKBest to select 20 features from the data. This also becomes a hyperparameter we want to optimize to improve the result of our machine learning models.
Don’t forget to dump any kinds of transformers you use at all the steps. You will need them to evaluate performance on the validation set.
Next (or intermediate) major step is model selection + hyperparameter optimization.

We generally use the following algorithms in the process of selecting a machine learning model:
Classification:
Random Forest
GBM
Logistic Regression
Naive Bayes
Support Vector Machines
k-Nearest Neighbors
Regression
Random Forest
GBM
Linear Regression
Ridge
Lasso
SVR
Which parameters should I optimize? How do I choose parameters closest to the best ones? These are a couple of questions people come up with most of the time. One cannot get answers to these questions without experience with different models + parameters on a large number of datasets. Also people who have experience are not willing to share their secrets. Luckily, I have quite a bit of experience too and I’m willing to give away some of the stuff.
Let’s break down the hyperparameters, model wise:

RS* = Cannot say about proper values, go for Random Search in these hyperparameters.
In my opinion, and strictly my opinion, the above models will out-perform any others and we don’t need to evaluate any other models.
Once again, remember to save the transformers:
And apply them on validation set separately:

The above rules and the framework has performed very well in most of the datasets I have dealt with. Of course, it has also failed for very complicated tasks. Nothing is perfect and we keep on improving on what we learn. Just like in machine learning.
Get in touch with me with any doubts: beyonditas [at] gmail [dot] com
The machine learning models are then applied to the tabular data. Tabular data is most common way of representing data in machine learning or data mining. We have a data table, rows with different samples of the data or X and labels, y. The labels can be single column or multi-column, depending on the type of problem. We will denote data by X and labels by y.
Types of labels
The labels define the problem and can be of different types, such as:Single column, binary values (classification problem, one sample belongs to one class only and there are only two classes)
Single column, real values (regression problem, prediction of only one value)
Multiple column, binary values (classification problem, one sample belongs to one class, but there are more than two classes)
Multiple column, real values (regression problem, prediction of multiple values)
And multi label (classification problem, one sample can belong to several classes)
Evaluation Metrics
For any kind of machine learning problem, we must know how we are going to evaluate our results, or what the evaluation metric or objective is. For example in case of a skewed binary classification problem we generally choose area under the receiver operating characteristic curve (ROC AUC or simply AUC). In case of multi-label or multi-class classification problems, we generally choose categorical cross-entropy or multiclass log loss and mean squared error in case of regression problems.
I won’t go into details of the different evaluation metrics as we can have many different types, depending on the problem.
The Libraries
To start with the machine learning libraries, install the basic and most important ones first, for example, numpy and scipy.
To see and do operations on data: pandas (http://pandas.pydata.org/)
For all kinds of machine learning models: scikit-learn (http://scikit-learn.org/stable/)
The best gradient boosting library: xgboost (https://github.com/dmlc/xgboost)
For neural networks: keras (http://keras.io/)
For plotting data: matplotlib (http://matplotlib.org/)
To monitor progress: tqdm (https://pypi.python.org/pypi/tqdm)
I don’t use Anaconda (https://www.continuum.io/downloads). It’s easy and does everything for you, but I want more freedom. The choice is yours.
The Machine Learning Framework
In 2015, I came up with a framework for automatic machine learning which is still under development and will be released soon. For this post, the same framework will be the basis. The framework is shown in the figure below:

A FRAMEWORK FOR MACHINE LEARNING COMPETITIONS, AUTOML WORKSHOP, INTERNATIONAL CONFERENCE ON MACHINE LEARNING 2015.
In the framework shown above, the pink lines represent the most common paths followed. After we have extracted and reduced the data to a tabular format, we can go ahead with building machine learning models.
The very first step is identification of the problem. This can be done by looking at the labels. One must know if the problem is a binary classification, a multi-class or multi-label classification or a regression problem. After we have identified the problem, we split the data into two different parts, a training set and a validation set as depicted in the figure below.

The splitting of data into training and validation sets “must” be done according to labels. In case of any kind of classification problem, use stratified splitting. In python, you can do this using scikit-learn very easily.

In case of regression task, a simple K-Fold splitting should suffice. There are, however, some complex methods which tend to keep the distribution of labels same for both training and validation set and this is left as an exercise for the reader.

I have chosen the eval_size or the size of the validation set as 10% of the full data in the examples above, but one can choose this value according to the size of the data they have.
After the splitting of the data is done, leave this data out and don’t touch it. Any operations that are applied on training set must be saved and then applied to the validation set. Validation set, in any case, should not be joined with the training set. Doing so will result in very good evaluation scores and make the user happy but instead he/she will be building a useless model with very high overfitting.
Next step is identification of different variables in the data. There are usually three types of variables we deal with. Namely, numerical variables, categorical variables and variables with text inside them. Let’s take example of the popular Titanic dataset (https://www.kaggle.com/c/titanic/data).

Here, survival is the label. We have already separated labels from the training data in the previous step. Then, we have pclass, sex, embarked. These variables have different levels and thus they are categorical variables. Variables like age, sibsp, parch, etc are numerical variables. Name is a variable with text data but I don’t think it’s a useful variable to predict survival.
Separate out the numerical variables first. These variables don’t need any kind of processing and thus we can start applying normalization and machine learning models to these variables.
There are two ways in which we can handle categorical data:
Convert the categorical data to labels

Convert the labels to binary variables (one-hot encoding)

Please remember to convert categories to numbers first using LabelEncoder before applying OneHotEncoder on it.
Since, the Titanic data doesn’t have good example of text variables, let’s formulate a general rule on handling text variables. We can combine all the text variables into one and then use some algorithms which work on text data and convert it to numbers.
The text variables can be joined as follows:

We can then use CountVectorizer or TfidfVectorizer on it:

or,

The TfidfVectorizer performs better than the counts most of the time and I have seen that the following parameters for TfidfVectorizer work almost all the time.

If you are applying these vectorizers only on the training set, make sure to dump it to hard drive so that you can use it later on the validation set.

Next, we come to the stacker module. Stacker module is not a model stacker but a feature stacker. The different features after the processing steps described above can be combined using the stacker module.

You can horizontally stack all the features before putting them through further processing by using numpy hstack or sparse hstack depending on whether you have dense or sparse features.

And can also be achieved by FeatureUnion module in case there are other processing steps such as pca or feature selection (we will visit decomposition and feature selection later in this post).

Once, we have stacked the features together, we can start applying machine learning models. At this stage only models you should go for should be ensemble tree based models. These models include:
RandomForestClassifier
RandomForestRegressor
ExtraTreesClassifier
ExtraTreesRegressor
XGBClassifier
XGBRegressor
We cannot apply linear models to the above features since they are not normalized. To use linear models, one can use Normalizer or StandardScaler from scikit-learn.
These normalization methods work only on dense features and don’t give very good results if applied on sparse features. Yes, one can apply StandardScaler on sparse matrices without using the mean (parameter: with_mean=False).
If the above steps give a “good” model, we can go for optimization of hyperparameters and in case it doesn’t we can go for the following steps and improve our model.
The next steps include decomposition methods:

For the sake of simplicity, we will leave out LDA and QDA transformations. For high dimensional data, generally PCA is used decompose the data. For images start with 10-15 components and increase this number as long as the quality of result improves substantially. For other type of data, we select 50-60 components initially (we tend to avoid PCA as long as we can deal with the numerical data as it is).

For text data, after conversion of text to sparse matrix, go for Singular Value Decomposition (SVD). A variation of SVD called TruncatedSVD can be found in scikit-learn.

The number of SVD components that generally work for TF-IDF or counts are between 120-200. Any number above this might improve the performance but not substantially and comes at the cost of computing power.
After evaluating further performance of the models, we move to scaling of the datasets, so that we can evaluate linear models too. The normalized or scaled features can then be sent to the machine learning models or feature selection modules.

There are multiple ways in which feature selection can be achieved. One of the most common way is greedy feature selection (forward or backward). In greedy feature selection we choose one feature, train a model and evaluate the performance of the model on a fixed evaluation metric. We keep adding and removing features one-by-one and record performance of the model at every step. We then select the features which have the best evaluation score. One implementation of greedy feature selection with AUC as evaluation metric can be found here:https://github.com/abhishekkrthakur/greedyFeatureSelection. It must be noted that this implementation is not perfect and must be changed/modified according to the requirements.
Other faster methods of feature selection include selecting best features from a model. We can either look at coefficients of a logit model or we can train a random forest to select best features and then use them later with other machine learning models.

Remember to keep low number of estimators and minimal optimization of hyper parameters so that you don’t overfit.
The feature selection can also be achieved using Gradient Boosting Machines. It is good if we use xgboost instead of the implementation of GBM in scikit-learn since xgboost is much faster and more scalable.

We can also do feature selection of sparse datasets using RandomForestClassifier / RandomForestRegressor and xgboost.
Another popular method for feature selection from positive sparse datasets is chi-2 based feature selection and we also have that implemented in scikit-learn.

Here, we use chi2 in conjunction with SelectKBest to select 20 features from the data. This also becomes a hyperparameter we want to optimize to improve the result of our machine learning models.
Don’t forget to dump any kinds of transformers you use at all the steps. You will need them to evaluate performance on the validation set.
Next (or intermediate) major step is model selection + hyperparameter optimization.

We generally use the following algorithms in the process of selecting a machine learning model:
Classification:
Random Forest
GBM
Logistic Regression
Naive Bayes
Support Vector Machines
k-Nearest Neighbors
Regression
Random Forest
GBM
Linear Regression
Ridge
Lasso
SVR
Which parameters should I optimize? How do I choose parameters closest to the best ones? These are a couple of questions people come up with most of the time. One cannot get answers to these questions without experience with different models + parameters on a large number of datasets. Also people who have experience are not willing to share their secrets. Luckily, I have quite a bit of experience too and I’m willing to give away some of the stuff.
Let’s break down the hyperparameters, model wise:

RS* = Cannot say about proper values, go for Random Search in these hyperparameters.
In my opinion, and strictly my opinion, the above models will out-perform any others and we don’t need to evaluate any other models.
Once again, remember to save the transformers:
And apply them on validation set separately:

The above rules and the framework has performed very well in most of the datasets I have dealt with. Of course, it has also failed for very complicated tasks. Nothing is perfect and we keep on improving on what we learn. Just like in machine learning.
Get in touch with me with any doubts: beyonditas [at] gmail [dot] com
fredag 8. juli 2016
Evolution of R
R is a programming language and software environment for statistical analysis, graphics representation and reporting. R was created by Ross Ihaka and Robert Gentleman at the University of Auckland, New Zealand, and is currently developed by the R Development Core Team.
The core of R is an interpreted computer language which allows branching and looping as well as modular programming using functions. R allows integration with the procedures written in the C, C++, .Net, Python or FORTRAN languages for efficiency.
R is freely available under the GNU General Public License, and pre-compiled binary versions are provided for various operating systems like Linux, Windows and Mac.
R is free software distributed under a GNU-style copy left, and an official part of the GNU project called GNU S.
Evolution of R
R was initially written by Ross Ihaka and Robert Gentleman at the Department of Statistics of the University of Auckland in Auckland, New Zealand. R made its first appearance in 1993.
- A large group of individuals has contributed to R by sending code and bug reports.
- Since mid-1997 there has been a core group (the "R Core Team") who can modify the R source code archive.
Features of R
As stated earlier, R is a programming language and software environment for statistical analysis, graphics representation and reporting. The following are the important features of R −
- R is a well-developed, simple and effective programming language which includes conditionals, loops, user defined recursive functions and input and output facilities.
- R has an effective data handling and storage facility,
- R provides a suite of operators for calculations on arrays, lists, vectors and matrices.
- R provides a large, coherent and integrated collection of tools for data analysis.
- R provides graphical facilities for data analysis and display either directly at the computer or printing at the papers.
As a conclusion, R is world’s most widely used statistics programming language. It's the # 1 choice of data scientists and supported by a vibrant and talented community of contributors. R is taught in universities and deployed in mission critical business applications. This tutorial will teach you R programming along with suitable examples in simple and easy steps.
onsdag 29. juni 2016
If social networks were countries, which would they be?

If Facebook were a country, it would be substantially bigger than China. The size of Facebook's user base translates to around one in seven of the global population using it each month - around 1.65 billion people.
The role of digital technology in breaking down physical borders is one of the many trends in the Fourth Industrial Revolution. As social media continues to open up new opportunities for businesses and societies, how do today's networks compare?
Facebook
According to Statista, Facebook had over 1.65 billion monthly active users in the first quarter of 2016. The number of monthly active mobile users also passed 1.5 billion in the same quarter. China's population, by comparison, is around 1.37 billion.
WhatsApp
While not technically a social network, it's worth including the messaging giant in this list due to the 1 billion-plus people using it each month. Monthly active users isn't the best metric for measuring messaging apps (you either use them daily-ish or not at all) but the MAU figure has grown impressively from 700 million in January 2015 to 1 billion now, putting it within sight of India, which has a population of 1.25 billion. The messaging app also handles over 64 billion messages and 600 million photos each day.
According to Statista, Facebook had over 1.65 billion monthly active users in the first quarter of 2016. The number of monthly active mobile users also passed 1.5 billion in the same quarter. China's population, by comparison, is around 1.37 billion.
While not technically a social network, it's worth including the messaging giant in this list due to the 1 billion-plus people using it each month. Monthly active users isn't the best metric for measuring messaging apps (you either use them daily-ish or not at all) but the MAU figure has grown impressively from 700 million in January 2015 to 1 billion now, putting it within sight of India, which has a population of 1.25 billion. The messaging app also handles over 64 billion messages and 600 million photos each day.

Top 15 countries by population, and the social media giants
Instagram
The photo- and video-sharing app reported over 400 million monthly active users worldwide in September 2015, just ahead of the US population of 319 million. Nearly all of these are engaging with the service via the mobile app, although there is also a desktop version. The number of Instagram users in the US is predicted to pass 106 million by 2018.
Twitter
The network for those happy to keep their musings to 140 characters or less, Twitter has over 305 million monthly active users, with around 80% living outside the US. The social network upset the apple cart last year somewhat with the introduction of a tailored algorithm to order tweets, moving away from a live feed, which upset some users. Growth has slowed, as well as the company's stock price, but it's still the go-to place for breaking news alerts and a glimpse of the world in real-time.
Google+
Google doesn't particularly like talking about its MAUs, and it's fair to say it isn't the obvious destination when people want to share something about themselves. At last count, the network had over 300 million users, which would make it bigger than Indonesia, and a tad smaller than the USA.
LinkedIn
LinkedIn's monthly active user base is growing robustly, with around 100 million people currently using the site each month. Over 400 million have an account, however. The social network generates revenue from 3 areas - hiring solutions, advertising revenue, and premium subscriptions. The 100 million MAUs puts it just behind the Philippines in terms of size.
Snapchat
The newest member of the social media giants, it was reported back in January last year that Snapchat had over 100 million monthly active users, which would make it around the same size as Ethiopia. However, data is hard to come by, with some other sources suggesting the figure could be as high as 200 million.
The photo- and video-sharing app reported over 400 million monthly active users worldwide in September 2015, just ahead of the US population of 319 million. Nearly all of these are engaging with the service via the mobile app, although there is also a desktop version. The number of Instagram users in the US is predicted to pass 106 million by 2018.
The network for those happy to keep their musings to 140 characters or less, Twitter has over 305 million monthly active users, with around 80% living outside the US. The social network upset the apple cart last year somewhat with the introduction of a tailored algorithm to order tweets, moving away from a live feed, which upset some users. Growth has slowed, as well as the company's stock price, but it's still the go-to place for breaking news alerts and a glimpse of the world in real-time.
Google+
Google doesn't particularly like talking about its MAUs, and it's fair to say it isn't the obvious destination when people want to share something about themselves. At last count, the network had over 300 million users, which would make it bigger than Indonesia, and a tad smaller than the USA.
LinkedIn's monthly active user base is growing robustly, with around 100 million people currently using the site each month. Over 400 million have an account, however. The social network generates revenue from 3 areas - hiring solutions, advertising revenue, and premium subscriptions. The 100 million MAUs puts it just behind the Philippines in terms of size.
Snapchat
The newest member of the social media giants, it was reported back in January last year that Snapchat had over 100 million monthly active users, which would make it around the same size as Ethiopia. However, data is hard to come by, with some other sources suggesting the figure could be as high as 200 million.
tirsdag 14. juni 2016
Moneyball: Sports Analytics in Soccer to Predict Performance and Outcomes
There is no doubt that soccer is the most popular sport in the world, and its popularity is growing in the US. Over 25 million fans watched U.S. Women’s FIFA World Cup 2015, and earned Fox over $40 million in ad revenue. Similarly, the United States’ 2-2 draw with Portugal in the 2014 World Cup was seen by an average of 24.7 million viewers on Univision and ESPN.
What's Sports Analytics?
Sports analytics is the processes that identify and acquire the knowledge and insight about potential players’ performances based on the use of a variety of data sources such as game data and individual player performance data. These advanced and sophisticated type of analytics should be able to extract valuable actionable insights for the coaches and managers to utilize.
Sports analytics can be utilized in various domains including:
Predicting the outcome of a game
Predicting the performances of teams or individual players
Building new strategies for upcoming competitions
Deciding the price of a player if a club was to rent/sell/buy him or her
Connecting players to brands and sponsors
Of course, not all teams use analytical tools. In addition to the costs involved, there’s also the problem of explaining complex analytical methods to coaches in ways they can understand. Thus, soccer analytics is more widespread in big clubs where they have the necessary financial power to utilize these methods.
But that should not necessarily be the case. Since traditional sports analysts do not reveal the logic behind their methods, we’ve decided to give you a flavor of what can be done with soccer data. While this post will not answer all the questions you have about soccer analytics, it can help you understand how to get started.
In this project, we have used a very limited number of player’s attributes (See the section under Player’s Features/Attributes) that are easy and not expensive to gather, to both reverse engineer the most advanced Rating and Performance index (The results are presented in Figures 1-12) and then to propose a more robust and easy model for future player ratings and performance prediction (See the section under Machine-Learning and AI Models). The program runs on Spark and Cloud Environment, and can be used for Terra-Petta scale of data, from multiple years, with thousands of players, with 100s of attributes.
What's Soccer Analytics?
Soccer Analytics is the art of creating insights and actionable decisions using soccer related data. While predictive analytics uses big data to determine the probability or the likelihood of a certain outcome, intelligent descriptive analytics looks at big data and analyzes it using machine learning and artificial intelligence methods to come of with suggestions that will improve the likelihood of a desired outcome.
Some important concepts to know while conducting this analysis are:
Game Modeling: Modeling of the game before, during and after the game using scientific techniques to match or predict a set of outcomes.
Expert Player Rating: Players ratings given by an expert. These ratings take a black-box approach, and they vary according to the prior knowledge of the expert.
Soccer Performance Analytics: Is a tool to help players, coaches and managers to quantitatively assess the players and team performance and help to improve both players and team performance and design a set of wining strategies for upcoming game(s).
Here are some questions to ask when running analysis on soccer players:
How does expert rating differ from ratings generated by data-driven Machine Learning ratings?
What are the most important players’ attributes linked to their performance?
What criteria do experts use when they evaluate Players? Is there a way to reverse engineer their criteria?
Which attributes are important for each specific position?
Can we use ratings and players’ attributes to predict the outcome of a game?
Can we aggregate the players’ rating to come up with a team rating?
Is there a way to correlate the team rating to the outcome of the game?
Do the outcomes of games influence expert ratings more than individual performance indicators do?
Can we predict the outcome of a new game given the past performance of the players?
Using advance analytics and visualization tools such as Machine Learning and network analytics to predict the outcomes of soccer games is becoming more and more popular as these methods continue to move into the mainstream with the help of tools that make it easier to conduct these advanced analytical methods.
Some insights to our approach:
In this project, we used our selected set of clustering and classification techniques and the best model was selected and ranked based on Train-Validation-Test process.
Companies such as OPTA, Prozone, Amisco, and WhoScored are now collecting rich soccer data. These can be utilized to conduct accurate assessments.
For our project, a rich data set containing more than 210 attributes of players including 198 performance statistics were used. To calculate the overall performance and ratings of the players, some or all of the attributes were being used. Some of the very advanced Expert Ratings include: Caapello Index, Castrol Index, and WhoScored.com. These Ratings include each player’s cumulative ratings and game-based ratings.
For classification-regression and clustering, there are many Machine learning models that can be used. For classification-regression model, you can use Machine Learning models (SVMs, logistic regression, linear regression), naive Bayes, Regression by Discretization using J48, Additive Regression with Decision Stump, decision trees, ensembles of trees (Random Forests and Gradient-Boosted Trees), isotonic regression, Multilayer Perceptron, RBF Network. For Clustering, you can use k-means, clustering using affinity propagation, Agglomerative Clustering (Ward, Average, and Complete), Gaussian mixture, power iteration clustering (PIC), latent Dirichlet allocation (LDA). Furthermore, you can use dimensionality reduction such as singular value decomposition (SVD) and principal component analysis (PCA) to reduce the feature space. In our case study, we tested all the models and the best results combined and are presented in Figures 1-12, without elaborating about specific model and how they can be aggregated.
Players' Features/Attributes:
In this project, we have used a subset of the Player’s Features/Attributes from the following list. Keep in mind that your model should be able to select and rank these attributes based on their importance. At this blog, we are not elaborating on what features have been selected by models, as these will depend on the specific approach you choose to take when building your model.
Nationality, Club, League, Age, Height, String Foot, Position (GK, CB, RB, LB, DM, CM, RM, LM, AM, RW, LW, SS, CF)
Attacking Prowess, Ball Control, Dribbling, Low Pass, Lofted Pass, Finishing
Place Kicking, Swerve, Header, Defensive Prowess, Ball Winning, Kicking Power, Speed, Explosive Power, Body Balance, Jump, Stamina, Goalkeeping, Saving, Form, Injury, Resistance, Weak Foot Use, Weak Foot Accuracy, Trickster, Mazing Run, Speeding Bullet,, Incisive Run, Long Ball Expert, Early Cross, Long Ranger
Scissors Feint, Flip Flap, Marseille Turn, Sombrero, Cut Behind & Turn, Scotch Move, Long Range Drive, Knuckle Shot, Acrobatic Finishing, First-time Shot, One-touch Pass, Weighted Pass, Pinpoint Crossing, Outside Curler, Low Punt Trajectory, Long Throw, GK Long Throw, Man Marking, Track Back, Captancy, Super-sub, Fighting Spirit
While, we do not have intention to disclose the final optimized features selected by our optimized model and strategy, we used the following ML-AL based aggregator operator model (Figure 13 shows the Structure of our Committee Machine).
Figures:
Finally, here's a list of the plots and figures created as a result of this analysis:

Figure 1. Clustering (similarities of players’ clusters) and prediction of the rating (plot: prediction vs. actual) for the Forward Players. Train, test and Validation. The similarities of the individual players are shown by the lines on clustering plots.

Figure 2. Clustering (similarities of players’ clusters) and prediction of the rating (plot: prediction vs. actual) for the Goalkeepers. Train, test and Validation. The similarities of the individual players are shown by the lines on clustering plots.

Figure 3. Clustering (similarities of players’ clusters) and prediction of the rating (plot: prediction vs. actual) for the Defensive Players. Train, test and Validation. The similarities of the individual players are shown by the lines on clustering plots.

Figure 4. Clustering (similarities of players’ clusters) and prediction of the rating (plot: prediction vs. actual) for the MidField Players. Train, test and Validation. The similarities of the individual players are shown by the lines on clustering plots.

Figure 5. Clustering (similarities of players’ clusters) using advanced Visual-Analytics-Clustering for Forward Players. The similarities of the individual players are shown by the lines and their strength with the width of lines on clustering plot.

Figure 6. Clustering (similarities of players’ clusters) using advanced Visual-Analytics-Clustering for Forward Players. Similar clusters are closer to each other.

Figure 7. Typical performance of our Regression model’s Prediction for the rating of the Forward players (Prediction Vs. Actual). Train data for Forward Players.

Figure 8. Typical performance of our Regression model’s Prediction for the rating of the Forward players (Prediction Vs. Actual). Validation data for Forward Players.

Figure 9. Typical performance of our Regression model’s Prediction for the rating of the Forward players (Prediction Vs. Actual). Test data for Forward Players.

Figure 10. Typical performance of our Regression model’s Prediction for the rating of the players (Prediction Vs. Actual). Test data for Forward-MidField-Defensive Players.

Figure 11. Typical performance of our Regression model’s Prediction for the rating of the players (Prediction Vs. Actual). Validation data for Forward-MidField-Defensive Players.

Figure 12. Typical performance of our Regression model’s Prediction for the rating of the players (Prediction Vs. Actual). Test data for Forward-MidField-Defensive Players.

Figure 13. Committee Machine, and Intelligent Multi-Level-Aggregator Tree (MAT) platform.
Abonner på:
Innlegg (Atom)