I am moving my blogg to : besimondata.com and I hope you will follow me there as well.
See you there!
Besim

Data Science blog
Viser innlegg med etiketten machine learning. Vis alle innlegg
Viser innlegg med etiketten machine learning. Vis alle innlegg
fredag 20. januar 2017

mandag 19. desember 2016
Modernizing data description
Illumination
In the recent times, few words (like Robotics, Artificial Intelligence, Analytics, Data Mining, Machine Learning, etc.) are powerful (sometime confusing) in IT industry.
In this competitive world, it is highly important for any software engineer to understand the concepts and usage of the emerging fields. Itz essential to survive in the rapid growth IT industry.
Based on my (l)earning through the premium technology institute and related work experience, I'm writing this article with the strong fundamentals and concepts around it.
Key Areas
In my view, these emerging fields are categorized into 4 key areas. Letz see them in details:
1. Statistics
We all know that Statistics is a study of how to collect, organizes, analyze, and interpret numerical information from data. Statistics can slip into two taxonomy namely:
1. Descriptive Statistics
2. Inferential Statistics
Descriptive statistics involves method of organizing, summering and picturing information from data. Familiar examples are Tables, Graphs, Averages. Descriptive statistics usually involve measures of central tendency (mean, median, mode) and measures of dispersion (variance, standard deviation, etc.)
Inferential statistics invokes method of using information from sample to draw conclusion about the population. Common terminologies are "Margin of error", "Statically Significant".
2. Artificial Intelligence (AI)
AI is a broad term referring to computers and systems that are capable of essentially coming up with solutions to problems on their own. The solutions aren’t hard-coded into the program; instead, the information needed to get to the solution is coded and AI (used often in medical diagnostics) uses the data and calculations to come up with a solution on its own.
 As depicted above, AI is the super set of the listed components and so itz a vast area to explore.
3. Machine Learning (ML)
Machine learning is capable of generalizing information from large data sets, and then detects and extrapolates patterns in order to apply that information to new solutions and actions. Obviously, certain parameters must be set up at the beginning of the machine learning process so that the machine is able to find, assess, and act upon new data

4. Data Mining
Data mining is an integral part of coding programs with the information, statistics, and data necessary for AI to create a solution

In the traditional reporting model, the data source is retrospective to look back and examines the exposure of the existing information. Descriptive analytics are useful because they allow us to learn from past behaviors, and understand how they might influence future outcomes.
Inter Connectivity
On connecting the dots of the above said 4 platforms, Artificial Intelligence is the foundation which is followed by Machine Learning, Statistics and Data Mining, chronologically. In simple term, AI (Artificial Intelligence) is the super set of all paradigm.

Artificial Intelligence is a science to develop a system or software to mimic human to respond and behave in a circumference.
Evolution of Statistics, AI, ML and Data Mining is depicted in the below chart.

Need of Chat Bot
On analyzing where people really spend time, you’ll probably get the details where the users are. Chat Bot is the low hanging fruit in terms of business & technical opportunity.
A Chat Bot can be easily built into any major commonly used chat product like Facebook Messenger or Slack. Latest industry data indicates that the end users reached more usage band of messenger apps than social networks, as depicted below:

We've another dimension of Messenger App usage. According to Statista, most popular global mobile messenger apps usage is pointed below, as of April 2016. Itz based on number of monthly active users (in millions).

Next Gen - Messaging
If you think about your daily interactions online, it won’t be that surprising – you use Slack or Skype to communicate with your colleagues at work, you talk to your closest friends on Facebook in Messenger, you probably have several chats with different groups of your friends depending on interests etc.

Chat Bots shift the shopping experience from browsing (web/retail stores) to recommendation. Bots learn about you, much like a trusted friend or personal shopper.
Chat Bot in Business
In Artificial Intelligence, Chat Bot plays a key tool by providing feedback to users on purchases with customer service agents on hand to provide further assistance.
In China, not only is WeChat used by close to two thirds of 16-24 year-old online consumers, but the service has capitalized on its massive market share by offering functionality well beyond simple messaging by attempting to insert itself into as many stations along the purchase journey as possible.
As the major part of digital consumers’ purchase journeys and online lives, Chat Bot will need to be non-intrusive, obviously beneficial to the user and, perhaps most importantly, present themselves as an honest assistant, not an advertisement in disguise.
As the summation of my analysis, 2 key business benefits of Chat Bot usage:
1. High automation in manual contact center business; leads to drastic cost reduction
2. Continuous improvement (on usage) is possible with the usage of Machine Learning in AI intelligent Chat Bot
Conclusion
What you research today may eventually underpin how you deploy a successful Chat Bot application for your business sooner rather than later once all the kinks get worked out. Get ready, folks !!
søndag 11. desember 2016
Personal Finance Application
Make Personal Finance fun again by automated segmentations, benchmarking gamification and automated machine learning budgeting tool.
ELA AS is newly founded startup with a clear mission to make use of data to benefit humanity. #DataForGood is our core value and a hashtag of our activities in social media. We have started with four projects, but we hope to continue with some more:
1. Personal Finance Digital Assistant which is an add-on solution to your digital bank account that gives you better picture of personal finances based on bench-marking against predefined data set of your segmentation (ex: income range, family members, region you live etc.) and fully automatized data input for all segments: cost, income and balance. This will include a machine learning (ML) algorithm that will suggest you the best way to save and invest money, how to overcome a financial difficulty and how to perform in budgeting your economy the best way.
We will soon be in Kickstarter and I hope that you will support our project!
The Deception of Supervised Learning
Do models or offline datasets ever really tell us what to do? Most application of supervised learning is predicated on this deception.

Imagine you're a doctor tasked with choosing a cancer therapy. Or a Netflix exec tasked with recommending movies. You have a choice. You could think hard about the problem and come up with some rules. But these rules would be overly simplistic, not personalized to the patient or customer. Alternatively, you could let the data decide what to do!
The ability to programmatically make intelligent decisions by learning complex decision rules from big data is a primary selling point of machine learning. Leaps forward in the predictive accuracy of supervised learning techniques, especially deep learning, now yield classifiers that outperform human predictive accuracy on many tasks. We can guess how an individual will rate a movie, classify images, or recognize speech with jaw-dropping accuracy. So why not make our services smart by letting the data tell us what to do?
Here's the rub.
While the supervised paradigm is but one of several in the machine learning canon, nearly all machine learning deployed in the real world amounts to supervised learning. And supervised learning methods doesn't tell us to doanything. That is, the theory and conception of supervised learning addresses pattern recognition but disregards the notion of interaction with an environment altogether.
[Quick crash course: in supervised learning, we collect a dataset of input-output (X,Y) pairs. The learning algorithm then uses this data to train a model. This model is simply a mapping from inputs to outputs. Now given a new input (such as a [drug,patient] pair), we can predict a likely output (say, 5-year survival). We determine the quality of the model by assessing its performance (say error rate or mean squared error) on hold-out data.]

Now suppose we train a model to predict 5-year survival given some features of the patient and the assigned treatment protocol. The survival model that we train doesn't know why drug A was prescribed to some patients and not others. And it has no way of knowing what will happen when you apply drug A to patients who previously wouldn't have received it. That's because supervised learning relies on the i.i.d. assumption. In short, this means that we expect the future data to be distributed identically like the past. With respect to temporal effects, we assume is that the distribution of data is stationary. But when we introduce a decision protocol based on a machine learning model to the world, we change the world, violating our assumptions. We alter the distribution of future data and thus should expect to invalidate our entire model.
For some tasks, like speech recognition, these concerns seem remote. Use of a voice transcription tool might not, in the short run, change how we speak. But in more dynamic decision-making contexts, the concerns should be paramount. For example, Rich Caruana of Microsoft Research showed a real-life model trained to predict risk of death for pneumonia patients. Presumably this information could be used to aid in triage. The model however, showed that asthma was predictive of lower risk. This was a true correlation in the data, but it owed to the more aggressive treatment such co-morbid patients received. Put simply, a researcher taking actions based on this information would be mistaking correlation for causation. And if a hospital used the risk score for triage, they would actually recklessly put the asthma patients at risk, thus invalidating the learned model model.
Supervised models can't tell us what to do because they fundamentally ignore the entire idea of an action. So what do people mean when they say that they act based on a model? Or when they say that the model (or the data) tells them what to do? How is Facebook's newsfeed algorithm curating stories? How is Netflix's recommender system curating movies?
Usually this means that we strap on some ad-hoc decision protocol to a predictive model. Say we have a model that takes a patient and a drug and predicts the probability of survival. A typical ad hoc rule might say that we should give the drug that maximizes the predicted probability of survival.

But this classifier is contingent on the historical standard of care. For one drug, a model might predict better outcomes because the drug truly causes better outcomes. But for others causality might be reversed, or the association might owe to unobserved factors. These kinds of actions encode ungrounded assumptions mistaking correlative association for causal relationships. While oncologists are not so reckless as to employ this reasoning willy-nilly, it's precisely the logic that underlies less consequential recommender systems all over the internet. Netflix doesn't account for how its recommendations influence your viewing habits, and Facebook's algorithms likely don't account for the effects of curation on reader behavior.
The failure to account for causality or interaction with the environment are but two among many deceptions underlying the modern use of supervised learning. Other, less fundamental, issues abound. For example, we often optimize surrogate objectives that only faintly resemble our true objectives. Search engines assume that mouse clicks indicate accurately answered queries. This means that when, in a momentary lapse of spine, you click on a celebrity break-up story after searching for an egg-salad recipe, the model registers a job a well done.
Some other issues to heap on the laundry list of common deceptions:
- Disregarding real-life cost-sensitivity
- Erroneous interpretation of predicted probabilities as quantifications of uncertainty
- Ignoring differences between constructed training sets and real world data
The overarching point here is that problem formulation for most machine learning systems can be badly mismatched against the real-world problems we're trying to solve. As detailed in my recent paper, The Mythos of Model Interpretability, it's this mismatch that leads people to wonder whether they can "trust" machine learning models.
Some machine learners suggest that the desire for an interpretation will pass - that it reflects an unease which will abate if the models are "good enough". But good enough at what? Minimizing cross-entropy loss on a surrogate task on a toy-dataset in a model that fundamentally ignores the decision-making process for which a model will be deployed? The suggestion is naive, but understandable. It reflects the years that many machine learners have spent single-mindedly focused on isolated tasks like image recognition. This focus was reasonable because these offline tasks were fundamental obstacles themselves, even absent the complication of reality. But as a result, reality is a relatively new concept to a machine learning community that increasingly rubs up against it.
So where do we go from here?
Model Interpretability
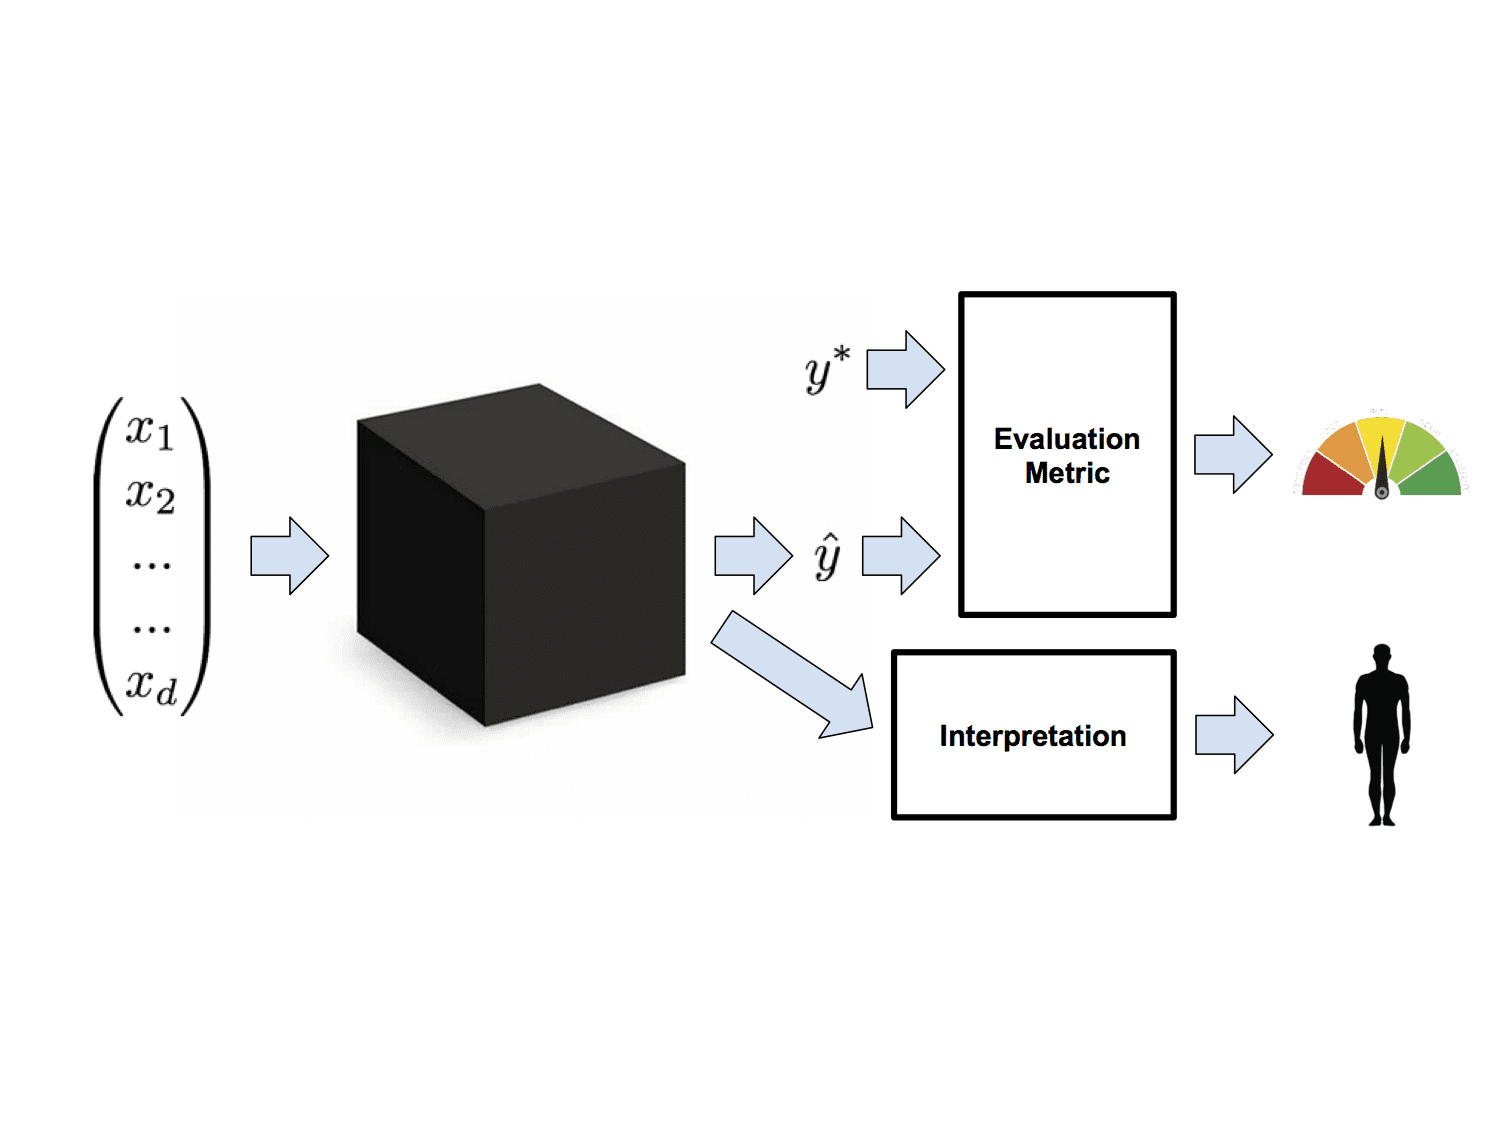
One solution is to go ahead and throw caution to the wind but then to interrogate the models to see if they're behaving acceptably. These efforts seek to interpret models to mitigate the mismatch between real and optimized objectives. The idea behind most work in interpretability is that in addition to the predictions required by our evaluation metrics, models should yield some additional information, which we term an interpretation. Interpretations can come in many varieties, notably transparency and post-hoc interpretability. The idea behind transparency is that we can introspect the model and determine precisely what it's doing. Unfortunately, the most useful models aren't especially transparent. Post-hoc interpretations, on the other hand, address techniques to extract explanations, even those from models we can't quite introspect. In the Mythos paper (https://arxiv.org/abs/1606.03490), I offer a broad taxonomy of both the objectives and techniques for interpreting supervised models.
Upgrade to More Sophisticated Paradigms of Learning
Another solution might be to close the gap between the real and modeled objectives. Some problems, like cost sensitivity, can be addressed within the supervised learning paradigm. Others, like causality, might require us to pursue fundamentally more powerful models of learning. Reinforcement learning (RL), for example, directly models an agent acting within a sequential decision making process. The framework captures the causal effects of taking actions and accounts for a distribution of data that changes per modifications to the policy. Unfortunately, practical RL techniques for sequential decision-making have only been reduced to practice on toy problems with relatively small action-spaces. Notable advances include Google Deepmind's Atari and Go-playing agents.
Several papers by groups including Steve Young's lab at Cambridge (paper), the research team at Montreal startup Maluuba (arxiv.org/abs/1606.03152), and my own work with Microsoft Research's Deep Learning team (arxiv.org/abs/1608.05081), seek to extend this progress into the more practically useful realm of dialogue systems.
Using RL in critical settings like medical care poses its own thorny set of problems. For example, RL agents typically learn by exploration. You could think of exploration as running an experiment. Just like a doctor might run a randomized trial, the RL agent periodically takes randomized actions, using the information gained to guide continued improvement of its policy. But when is it OK to run experiments with human subjects? To do any research on human subjects, even the most respected researchers are required to submit to an ethics board. Can we then turn relatively imbecilic agents loose to experiment on human subjects absent oversight?
Conclusions
Supervised learning is simultaneously unacceptable, inadequate, and yet, at present, the most powerful tool at our disposal. While it's only reasonable to pillory the paradigm with criticism, it remains nonetheless the most practically useful tool around. Nonetheless I'd propose the following takeaways:- We should aspire to unseat the primacy of strictly supervised solutions. Improvements in reinforcement learning offer a promising alternative.
- Even within the supervised learning paradigm, we should work harder to eliminate those flaws of problem formulation that are avoidable.
- We should remain suspicious of the behavior of live systems, and devise mechanisms to both understand them and provide guard-rails to protect against unacceptable outcomes.
 Zachary Chase Lipton is a PhD student in the Computer Science Engineering department at the University of California, San Diego. He is interested in both theoretical foundations and applications of machine learning. In addition to his work at UCSD, he has interned at Microsoft Research Labs and as a Machine Learning Scientist at Amazon, and is a Contributing Editor at KDnuggets.
Related:
- The Hard Problems AI Can’t (Yet) Touch
- Does Deep Learning Come from the Devil?
- MetaMind Competes with IBM Watson Analytics and Microsoft Azure Machine Learning
- Deep Learning and the Triumph of Empiricism
- The Myth of Model Interpretability
- (Deep Learning’s Deep Flaws)’s Deep Flaws
- Data Science’s Most Used, Confused, and Abused Jargon
mandag 28. november 2016
Start-up of the week: Instalocate- A chatbot that claims to make your travel more comfortable!

Img Source: Instalocate | www.instalocate.com
Did you know that every time your flight gets delayed your airlines owes you a compensation? Have you ever been denied boarding because the flight was overbooked? Are you aware of your rights as a flyer? Many a times we overlook on these issues and incur heavy losses, but not anymore. The one company founded by Stanford University and Indian Institute of Management (IIM) alumni in June 2016, is building an AI powered travel assistant just for you!
Instalocate– the name as it goes by – promises to watch all that for you by building a cutting-edge technology that can solve all your travel problems and make your journey comfortable. No more panicking and rushing to the airline counters, standing in long queues or calling the customer care if your flight gets delayed or baggages do not come on time! Instalocate promises to constantly monitor your travel and predict and solve the travel problems.
Not just that, it would also protect your rights as a customer and go after airlines to get your due compensation in case of any mishap.
How wonderful is that? Having a digital personal assistant that can make your journey comfortable and be always there to answer all your questions in an instant!
Talking to AIM, one of its founders Pallavi Singh revealed that the idea of Instalocate was conceived out of all the unfortunate incidences that she and her husband had personally faced.
“Anything that can go wrong has gone wrong with us. Flights have gotten delayed, we have missed connections, baggage was lost. And that’s when we realised that, most of the travel apps are working in pre-booking and there is no one to help you when things like this go wrong. Dealing with the airlines was the biggest nightmare amidst this”, she said.
And that’s how the journey to Instalocate took off with an idea of building an assistant which could help during the travel woes and deals with the airline on your behalf. Pallavi confesses “At so many times, we felt so frustrated with the airlines that we wanted to sue them for compensation, for all the trouble we went through. But we never did- mainly because we never had the time to deal with the airlines.”
With Instalocate, all you have to do is share your flight details and it will predict when you might need something and would send the contextual information automatically. Just ask your assistant anything from your flight status to the free Wi-Fi availability in the airport! That’s not all, if your family is worried about you, the assistant can pinpoint your exact location in the air. They don’t have to anxiously wait outside the airport checking their phones again and again! After reaching your destination, your cab will be waiting for you.
How is all of it achieved? Talking about the integration of artificial intelligence to Instalocate, Pallavi said “It is a predictive engine which will predict when the airlines owe you compensation. Unlike others we don’t wait for you to search for that information rather we will bring it to you. We are also building in-house NLP which makes it easier for an end user to talk to us, just as they would talk to a friend.”
There is no doubt that the bot has been received well by its users. “We have only launched our first product and the people are loving it”, marked Pallavi. Citing a use case, she said “One of our power users recently got 800 dollars from British Airways for flight delay with the help of Instalocate.”
However, the journey to its popularity was not easy. Pallavi notes that making was not as challenging as marketing. “Bots is still a new concept for people and popularizing it is a big problem”, she added.
Well, despite the challenges, Instalocate has done quite well for itself and is growing at a rate of 60 month over month with a pretty high retention rate.
This digital personal assistant is available to make your journey comfortable and answer your questions in an instant. Talk to Instalocate within facebook at m.me/instalocate for a hassle-free travel now. There is no need to install the app separately, which adds to the many perks this travel bot has!
tirsdag 26. juli 2016
Approaching (Almost) Any Machine Learning Problem
An average data scientist deals with loads of data daily. Some say over 60-70% time is spent in data cleaning, munging and bringing data to a suitable format such that machine learning models can be applied on that data. This post focuses on the second part, i.e., applying machine learning models, including the pre-processing steps. The pipelines discussed in this post come as a result of over a hundred machine learning competitions that I’ve taken part in. It must be noted that the discussion here is very general but very useful and there can also be very complicated methods which exist and are practiced by professionals.
We will be using python!
We will be using python!
Data
Before applying the machine learning models, the data must be converted to a tabular form. This whole process is the most time consuming and difficult process and is depicted in the figure below.

The machine learning models are then applied to the tabular data. Tabular data is most common way of representing data in machine learning or data mining. We have a data table, rows with different samples of the data or X and labels, y. The labels can be single column or multi-column, depending on the type of problem. We will denote data by X and labels by y.
Single column, binary values (classification problem, one sample belongs to one class only and there are only two classes)
Single column, real values (regression problem, prediction of only one value)
Multiple column, binary values (classification problem, one sample belongs to one class, but there are more than two classes)
Multiple column, real values (regression problem, prediction of multiple values)
And multi label (classification problem, one sample can belong to several classes)
Evaluation Metrics
For any kind of machine learning problem, we must know how we are going to evaluate our results, or what the evaluation metric or objective is. For example in case of a skewed binary classification problem we generally choose area under the receiver operating characteristic curve (ROC AUC or simply AUC). In case of multi-label or multi-class classification problems, we generally choose categorical cross-entropy or multiclass log loss and mean squared error in case of regression problems.
I won’t go into details of the different evaluation metrics as we can have many different types, depending on the problem.
The Libraries
To start with the machine learning libraries, install the basic and most important ones first, for example, numpy and scipy.
To see and do operations on data: pandas (http://pandas.pydata.org/)
For all kinds of machine learning models: scikit-learn (http://scikit-learn.org/stable/)
The best gradient boosting library: xgboost (https://github.com/dmlc/xgboost)
For neural networks: keras (http://keras.io/)
For plotting data: matplotlib (http://matplotlib.org/)
To monitor progress: tqdm (https://pypi.python.org/pypi/tqdm)
I don’t use Anaconda (https://www.continuum.io/downloads). It’s easy and does everything for you, but I want more freedom. The choice is yours.
The Machine Learning Framework
In 2015, I came up with a framework for automatic machine learning which is still under development and will be released soon. For this post, the same framework will be the basis. The framework is shown in the figure below:

A FRAMEWORK FOR MACHINE LEARNING COMPETITIONS, AUTOML WORKSHOP, INTERNATIONAL CONFERENCE ON MACHINE LEARNING 2015.
In the framework shown above, the pink lines represent the most common paths followed. After we have extracted and reduced the data to a tabular format, we can go ahead with building machine learning models.
The very first step is identification of the problem. This can be done by looking at the labels. One must know if the problem is a binary classification, a multi-class or multi-label classification or a regression problem. After we have identified the problem, we split the data into two different parts, a training set and a validation set as depicted in the figure below.

The splitting of data into training and validation sets “must” be done according to labels. In case of any kind of classification problem, use stratified splitting. In python, you can do this using scikit-learn very easily.

In case of regression task, a simple K-Fold splitting should suffice. There are, however, some complex methods which tend to keep the distribution of labels same for both training and validation set and this is left as an exercise for the reader.

I have chosen the eval_size or the size of the validation set as 10% of the full data in the examples above, but one can choose this value according to the size of the data they have.
After the splitting of the data is done, leave this data out and don’t touch it. Any operations that are applied on training set must be saved and then applied to the validation set. Validation set, in any case, should not be joined with the training set. Doing so will result in very good evaluation scores and make the user happy but instead he/she will be building a useless model with very high overfitting.
Next step is identification of different variables in the data. There are usually three types of variables we deal with. Namely, numerical variables, categorical variables and variables with text inside them. Let’s take example of the popular Titanic dataset (https://www.kaggle.com/c/titanic/data).

Here, survival is the label. We have already separated labels from the training data in the previous step. Then, we have pclass, sex, embarked. These variables have different levels and thus they are categorical variables. Variables like age, sibsp, parch, etc are numerical variables. Name is a variable with text data but I don’t think it’s a useful variable to predict survival.
Separate out the numerical variables first. These variables don’t need any kind of processing and thus we can start applying normalization and machine learning models to these variables.
There are two ways in which we can handle categorical data:
Convert the categorical data to labels

Convert the labels to binary variables (one-hot encoding)

Please remember to convert categories to numbers first using LabelEncoder before applying OneHotEncoder on it.
Since, the Titanic data doesn’t have good example of text variables, let’s formulate a general rule on handling text variables. We can combine all the text variables into one and then use some algorithms which work on text data and convert it to numbers.
The text variables can be joined as follows:

We can then use CountVectorizer or TfidfVectorizer on it:

or,

The TfidfVectorizer performs better than the counts most of the time and I have seen that the following parameters for TfidfVectorizer work almost all the time.

If you are applying these vectorizers only on the training set, make sure to dump it to hard drive so that you can use it later on the validation set.

Next, we come to the stacker module. Stacker module is not a model stacker but a feature stacker. The different features after the processing steps described above can be combined using the stacker module.

You can horizontally stack all the features before putting them through further processing by using numpy hstack or sparse hstack depending on whether you have dense or sparse features.

And can also be achieved by FeatureUnion module in case there are other processing steps such as pca or feature selection (we will visit decomposition and feature selection later in this post).

Once, we have stacked the features together, we can start applying machine learning models. At this stage only models you should go for should be ensemble tree based models. These models include:
RandomForestClassifier
RandomForestRegressor
ExtraTreesClassifier
ExtraTreesRegressor
XGBClassifier
XGBRegressor
We cannot apply linear models to the above features since they are not normalized. To use linear models, one can use Normalizer or StandardScaler from scikit-learn.
These normalization methods work only on dense features and don’t give very good results if applied on sparse features. Yes, one can apply StandardScaler on sparse matrices without using the mean (parameter: with_mean=False).
If the above steps give a “good” model, we can go for optimization of hyperparameters and in case it doesn’t we can go for the following steps and improve our model.
The next steps include decomposition methods:

For the sake of simplicity, we will leave out LDA and QDA transformations. For high dimensional data, generally PCA is used decompose the data. For images start with 10-15 components and increase this number as long as the quality of result improves substantially. For other type of data, we select 50-60 components initially (we tend to avoid PCA as long as we can deal with the numerical data as it is).

For text data, after conversion of text to sparse matrix, go for Singular Value Decomposition (SVD). A variation of SVD called TruncatedSVD can be found in scikit-learn.

The number of SVD components that generally work for TF-IDF or counts are between 120-200. Any number above this might improve the performance but not substantially and comes at the cost of computing power.
After evaluating further performance of the models, we move to scaling of the datasets, so that we can evaluate linear models too. The normalized or scaled features can then be sent to the machine learning models or feature selection modules.

There are multiple ways in which feature selection can be achieved. One of the most common way is greedy feature selection (forward or backward). In greedy feature selection we choose one feature, train a model and evaluate the performance of the model on a fixed evaluation metric. We keep adding and removing features one-by-one and record performance of the model at every step. We then select the features which have the best evaluation score. One implementation of greedy feature selection with AUC as evaluation metric can be found here:https://github.com/abhishekkrthakur/greedyFeatureSelection. It must be noted that this implementation is not perfect and must be changed/modified according to the requirements.
Other faster methods of feature selection include selecting best features from a model. We can either look at coefficients of a logit model or we can train a random forest to select best features and then use them later with other machine learning models.

Remember to keep low number of estimators and minimal optimization of hyper parameters so that you don’t overfit.
The feature selection can also be achieved using Gradient Boosting Machines. It is good if we use xgboost instead of the implementation of GBM in scikit-learn since xgboost is much faster and more scalable.

We can also do feature selection of sparse datasets using RandomForestClassifier / RandomForestRegressor and xgboost.
Another popular method for feature selection from positive sparse datasets is chi-2 based feature selection and we also have that implemented in scikit-learn.

Here, we use chi2 in conjunction with SelectKBest to select 20 features from the data. This also becomes a hyperparameter we want to optimize to improve the result of our machine learning models.
Don’t forget to dump any kinds of transformers you use at all the steps. You will need them to evaluate performance on the validation set.
Next (or intermediate) major step is model selection + hyperparameter optimization.

We generally use the following algorithms in the process of selecting a machine learning model:
Classification:
Random Forest
GBM
Logistic Regression
Naive Bayes
Support Vector Machines
k-Nearest Neighbors
Regression
Random Forest
GBM
Linear Regression
Ridge
Lasso
SVR
Which parameters should I optimize? How do I choose parameters closest to the best ones? These are a couple of questions people come up with most of the time. One cannot get answers to these questions without experience with different models + parameters on a large number of datasets. Also people who have experience are not willing to share their secrets. Luckily, I have quite a bit of experience too and I’m willing to give away some of the stuff.
Let’s break down the hyperparameters, model wise:

RS* = Cannot say about proper values, go for Random Search in these hyperparameters.
In my opinion, and strictly my opinion, the above models will out-perform any others and we don’t need to evaluate any other models.
Once again, remember to save the transformers:
And apply them on validation set separately:

The above rules and the framework has performed very well in most of the datasets I have dealt with. Of course, it has also failed for very complicated tasks. Nothing is perfect and we keep on improving on what we learn. Just like in machine learning.
Get in touch with me with any doubts: beyonditas [at] gmail [dot] com
The machine learning models are then applied to the tabular data. Tabular data is most common way of representing data in machine learning or data mining. We have a data table, rows with different samples of the data or X and labels, y. The labels can be single column or multi-column, depending on the type of problem. We will denote data by X and labels by y.
Types of labels
The labels define the problem and can be of different types, such as:Single column, binary values (classification problem, one sample belongs to one class only and there are only two classes)
Single column, real values (regression problem, prediction of only one value)
Multiple column, binary values (classification problem, one sample belongs to one class, but there are more than two classes)
Multiple column, real values (regression problem, prediction of multiple values)
And multi label (classification problem, one sample can belong to several classes)
Evaluation Metrics
For any kind of machine learning problem, we must know how we are going to evaluate our results, or what the evaluation metric or objective is. For example in case of a skewed binary classification problem we generally choose area under the receiver operating characteristic curve (ROC AUC or simply AUC). In case of multi-label or multi-class classification problems, we generally choose categorical cross-entropy or multiclass log loss and mean squared error in case of regression problems.
I won’t go into details of the different evaluation metrics as we can have many different types, depending on the problem.
The Libraries
To start with the machine learning libraries, install the basic and most important ones first, for example, numpy and scipy.
To see and do operations on data: pandas (http://pandas.pydata.org/)
For all kinds of machine learning models: scikit-learn (http://scikit-learn.org/stable/)
The best gradient boosting library: xgboost (https://github.com/dmlc/xgboost)
For neural networks: keras (http://keras.io/)
For plotting data: matplotlib (http://matplotlib.org/)
To monitor progress: tqdm (https://pypi.python.org/pypi/tqdm)
I don’t use Anaconda (https://www.continuum.io/downloads). It’s easy and does everything for you, but I want more freedom. The choice is yours.
The Machine Learning Framework
In 2015, I came up with a framework for automatic machine learning which is still under development and will be released soon. For this post, the same framework will be the basis. The framework is shown in the figure below:

A FRAMEWORK FOR MACHINE LEARNING COMPETITIONS, AUTOML WORKSHOP, INTERNATIONAL CONFERENCE ON MACHINE LEARNING 2015.
In the framework shown above, the pink lines represent the most common paths followed. After we have extracted and reduced the data to a tabular format, we can go ahead with building machine learning models.
The very first step is identification of the problem. This can be done by looking at the labels. One must know if the problem is a binary classification, a multi-class or multi-label classification or a regression problem. After we have identified the problem, we split the data into two different parts, a training set and a validation set as depicted in the figure below.

The splitting of data into training and validation sets “must” be done according to labels. In case of any kind of classification problem, use stratified splitting. In python, you can do this using scikit-learn very easily.

In case of regression task, a simple K-Fold splitting should suffice. There are, however, some complex methods which tend to keep the distribution of labels same for both training and validation set and this is left as an exercise for the reader.

I have chosen the eval_size or the size of the validation set as 10% of the full data in the examples above, but one can choose this value according to the size of the data they have.
After the splitting of the data is done, leave this data out and don’t touch it. Any operations that are applied on training set must be saved and then applied to the validation set. Validation set, in any case, should not be joined with the training set. Doing so will result in very good evaluation scores and make the user happy but instead he/she will be building a useless model with very high overfitting.
Next step is identification of different variables in the data. There are usually three types of variables we deal with. Namely, numerical variables, categorical variables and variables with text inside them. Let’s take example of the popular Titanic dataset (https://www.kaggle.com/c/titanic/data).

Here, survival is the label. We have already separated labels from the training data in the previous step. Then, we have pclass, sex, embarked. These variables have different levels and thus they are categorical variables. Variables like age, sibsp, parch, etc are numerical variables. Name is a variable with text data but I don’t think it’s a useful variable to predict survival.
Separate out the numerical variables first. These variables don’t need any kind of processing and thus we can start applying normalization and machine learning models to these variables.
There are two ways in which we can handle categorical data:
Convert the categorical data to labels

Convert the labels to binary variables (one-hot encoding)

Please remember to convert categories to numbers first using LabelEncoder before applying OneHotEncoder on it.
Since, the Titanic data doesn’t have good example of text variables, let’s formulate a general rule on handling text variables. We can combine all the text variables into one and then use some algorithms which work on text data and convert it to numbers.
The text variables can be joined as follows:

We can then use CountVectorizer or TfidfVectorizer on it:

or,

The TfidfVectorizer performs better than the counts most of the time and I have seen that the following parameters for TfidfVectorizer work almost all the time.

If you are applying these vectorizers only on the training set, make sure to dump it to hard drive so that you can use it later on the validation set.

Next, we come to the stacker module. Stacker module is not a model stacker but a feature stacker. The different features after the processing steps described above can be combined using the stacker module.

You can horizontally stack all the features before putting them through further processing by using numpy hstack or sparse hstack depending on whether you have dense or sparse features.

And can also be achieved by FeatureUnion module in case there are other processing steps such as pca or feature selection (we will visit decomposition and feature selection later in this post).

Once, we have stacked the features together, we can start applying machine learning models. At this stage only models you should go for should be ensemble tree based models. These models include:
RandomForestClassifier
RandomForestRegressor
ExtraTreesClassifier
ExtraTreesRegressor
XGBClassifier
XGBRegressor
We cannot apply linear models to the above features since they are not normalized. To use linear models, one can use Normalizer or StandardScaler from scikit-learn.
These normalization methods work only on dense features and don’t give very good results if applied on sparse features. Yes, one can apply StandardScaler on sparse matrices without using the mean (parameter: with_mean=False).
If the above steps give a “good” model, we can go for optimization of hyperparameters and in case it doesn’t we can go for the following steps and improve our model.
The next steps include decomposition methods:

For the sake of simplicity, we will leave out LDA and QDA transformations. For high dimensional data, generally PCA is used decompose the data. For images start with 10-15 components and increase this number as long as the quality of result improves substantially. For other type of data, we select 50-60 components initially (we tend to avoid PCA as long as we can deal with the numerical data as it is).

For text data, after conversion of text to sparse matrix, go for Singular Value Decomposition (SVD). A variation of SVD called TruncatedSVD can be found in scikit-learn.

The number of SVD components that generally work for TF-IDF or counts are between 120-200. Any number above this might improve the performance but not substantially and comes at the cost of computing power.
After evaluating further performance of the models, we move to scaling of the datasets, so that we can evaluate linear models too. The normalized or scaled features can then be sent to the machine learning models or feature selection modules.

There are multiple ways in which feature selection can be achieved. One of the most common way is greedy feature selection (forward or backward). In greedy feature selection we choose one feature, train a model and evaluate the performance of the model on a fixed evaluation metric. We keep adding and removing features one-by-one and record performance of the model at every step. We then select the features which have the best evaluation score. One implementation of greedy feature selection with AUC as evaluation metric can be found here:https://github.com/abhishekkrthakur/greedyFeatureSelection. It must be noted that this implementation is not perfect and must be changed/modified according to the requirements.
Other faster methods of feature selection include selecting best features from a model. We can either look at coefficients of a logit model or we can train a random forest to select best features and then use them later with other machine learning models.

Remember to keep low number of estimators and minimal optimization of hyper parameters so that you don’t overfit.
The feature selection can also be achieved using Gradient Boosting Machines. It is good if we use xgboost instead of the implementation of GBM in scikit-learn since xgboost is much faster and more scalable.

We can also do feature selection of sparse datasets using RandomForestClassifier / RandomForestRegressor and xgboost.
Another popular method for feature selection from positive sparse datasets is chi-2 based feature selection and we also have that implemented in scikit-learn.

Here, we use chi2 in conjunction with SelectKBest to select 20 features from the data. This also becomes a hyperparameter we want to optimize to improve the result of our machine learning models.
Don’t forget to dump any kinds of transformers you use at all the steps. You will need them to evaluate performance on the validation set.
Next (or intermediate) major step is model selection + hyperparameter optimization.

We generally use the following algorithms in the process of selecting a machine learning model:
Classification:
Random Forest
GBM
Logistic Regression
Naive Bayes
Support Vector Machines
k-Nearest Neighbors
Regression
Random Forest
GBM
Linear Regression
Ridge
Lasso
SVR
Which parameters should I optimize? How do I choose parameters closest to the best ones? These are a couple of questions people come up with most of the time. One cannot get answers to these questions without experience with different models + parameters on a large number of datasets. Also people who have experience are not willing to share their secrets. Luckily, I have quite a bit of experience too and I’m willing to give away some of the stuff.
Let’s break down the hyperparameters, model wise:

RS* = Cannot say about proper values, go for Random Search in these hyperparameters.
In my opinion, and strictly my opinion, the above models will out-perform any others and we don’t need to evaluate any other models.
Once again, remember to save the transformers:
And apply them on validation set separately:

The above rules and the framework has performed very well in most of the datasets I have dealt with. Of course, it has also failed for very complicated tasks. Nothing is perfect and we keep on improving on what we learn. Just like in machine learning.
Get in touch with me with any doubts: beyonditas [at] gmail [dot] com
torsdag 23. juni 2016
The New Rules for Becoming a Data Scientist
Summary: What do you need to do to get an entry level job in data
science?

This article is written for anyone who is considering becoming a data
scientist. That includes young people just starting their bachelor’s
degrees and folks in the first two or three years of their careers who want to
make the switch.
It’s not for
folks who know they are going to pursue one of the new Master’s in Data Science
or Ph.D. candidates. It’s for folks looking for entry level jobs that are
specifically on the data science career ladder.
Is There a Data Science Career Progression That Doesn’t Require an
Advanced Degree?
Yes there
is. Like many high skill professions that’s not to say that an advanced
degree won’t make it easier but there are definitely ways to enter this market
with only a bachelor’s degree.
If you’ve
been practicing data science for more than five or ten years you also know that
the majority of us over 35 don’t have specific data science degrees. We
came to data science via a variety of related disciplines and gained our cred
largely based on performance and experience. It’s only the cohort under
35 working in data science that’s likely to have a DS-specific degree, advanced
or bachelor’s.
The flack
this article is likely to draw is not over the level of degree required or the
types of experience but the just-below-boiling controversy about who gets to
call themselves a data scientist. The problem in our profession, and I’m
not going to solve it here, is there is not an accepted nomenclature that differentiates
the various skill levels of data scientists or who gets to wear that title at
all.
Employers
aren’t helping since actual data science jobs may be called engineer, analyst,
developer, team lead or many other less exciting sounding titles. Other
employers are giving data science titles to folks who are not really doing data
science, but more descriptive analytics and straight EDW work.
So for simplicity’s sake I’m going to call our target audience folks
who are seeking positions as Junior or Associate Data
Scientists. Specifically that means doing work that involves
detecting signals in the data that can be used to make predictions about future
behavior. Not simple descriptive historical analysis of what’s happened
in the past.
For Beginners What Does the Market Look Like and What Type of Work Will
You Do?

There are two key points to understand here. The first is that
the data science market has divided into two distinctly different segments,
Production and Development.
Production: This
is by far the largest and most mature segment where predictive analytics has
been used for longest and where it is best integrated to create truly
data-driven businesses. Large B2C service businesses dominate this group,
specifically insurance, financial services, cable and telecos, healthcare, plus
retail, ecommerce, and some manufacturing. These companies are widely
distributed geographically so you can work pretty much anywhere. The
primary data science activities are predictive analytics and recommenders.
Development: This
is the new and sexy world of data science that gets all the press
coverage. In these enterprises the data science and the code are the
product. Think Google, Facebook, eHarmony, Apple, and the thousands of
start-ups that are either developing new analytic and big data platforms, or
products with embedded analytics. This is also where you find the newest
developments in data science including deep learning for image, text, and
speech recognition, much of IoT (some crossover here to the production world),
and all the flavors of AI.
The
Development world is geographically concentrated in a few areas that we all
know: the Bay area, Silicon Beach, New York, Boston, and maybe Austin.
This is exciting and heady stuff where you will probably devote upwards of 60%
to 70% of your substantial starting salary to rent.
As a new
Associate Data Scientist you are much more likely to find your first career
step in the Production world.
The Four Paths of Data Science
The second
main point is that your career progression in DS will probably take you down
one of four paths represented by different types of data scientists.
These four types are ultimately differentiated by what they spend their time
doing.
The best analysis that I’ve seen on this comes from the O’Reilly paper
“Analyzing the Analyzers” by Harris, Murphy, and Vaisman, 2013. You can
find the original at http://www.oreilly.com/data/free/analyzing-the-analyzers.csp and I strongly encourage you to read it.
There are 40 pages of good analysis here or for the Cliff Notes version
see my previous article How to Become a Data
Scientist.
In short,
they conclude there are four types of Data Scientists differentiated not so
much by the breadth of knowledge, which is similar, but their depth in specific
areas and how each type prefers to interact with data science problems.
1.
Data
Businesspeople are those that are
most focused on the organization and how data projects yield profit. At the
entry level you’ll be performing the junior duties of blending and cleaning
data and preparing basic predictive models.
2.
Data
Developer. Focused on the technical problem of
managing data — how to get it, store it, and learn from it. At the entry level
you’ll be working with Hadoop as well as structured data. If you are more
interested in the data science infrastructure side this may be for you and is a
particularly good path for a current analyst and IT staff to move up into the
data science career path.
3. Data Creatives. Often
tackle the entire soup-to-nuts analytics process on their own: from extracting
and blending data, to performing advanced analyses and building models, to
creating visualizations and interpretations. This is a more senior role
innovating new types of predictive analytic use cases, data products, and
services. This may also be you if you find yourself in a company with
little or no experience with advanced analytics but you’re unlikely to get this
job fresh out of college with no experience. Data Creatives are
heavily present in the Development world.
4.
Data
Researchers. Nearly 75% of Data
Researchers have published in peer-reviewed journals and over half have a PhD.
These are folks who are innovating data science at its most fundamental
level.
According to
Harris, Murphy, and Vaisman it’s not the skills that are different but the way
we choose to emphasize them in our approach to Data Science problems. Here’s their
chart.

This is an
important decision since you need to do activities within data science that you
like. This may lead you toward an advanced degree or simply to develop
you skills through experience. It’s not something you have to decide from
day one but one that you’ll want to consider early in your career.
The Skills You’ll Need to Enter the Data Science Market
If you were
shopping for a two-year Master’s Degree in Data Science you’d have lots to pick
from. If you search for Bachelor’s degrees in Data Science you’ll find a
good selection but at many institutions the undergraduate degree is more likely
to be titled ‘Computer Science’ leaving you to wonder if you’re actually getting
the knowledge that you need.
If you have
a choice, pick a college that specifically offers a Data Science degree.
If you don’t have that choice you’ll have to analyze and select the blocks of
learning that you’ll need.
Yes you need to be grounded in the broad aspects of computer science
but in addition there are specific skills and knowledge you’ll need to
master. The best description I’ve seen for this incremental learning is
also an excellent guide for those of you who have recently finished your bachelors.
It’s from an article by Amy Gershkoff, the Chief Data Officer at Zynga and
describes their in-house program for growing their own data
scientists.
Zynga’s
in-house program is 12 to 18 months. To be considered there are a variety
of performance requirements and academically the candidate needs a minimum of
two previous semesters of coursework in statistics, economics, computer
science, or similar. At Zynga, some of this is in an on-line academic
environment and some is mentored by their in-house data scientists. This
could easily be the course list for your undergraduate program. I have
added some observations of my own.
Phase I: Foundational Statistical Theory
Participants learn the basics of probability theory and statistical
analysis including sampling theory, hypothesis testing, and statistical
distributions. For statistical analysis, topics include correlation,
standard deviations, and basic regression analysis, among others. Usually
one to two semesters of an online statistics course (such as Princeton University’s online course) covers this material.
Phase II: Foundational Programming Skills
To be an
effective data scientist, knowledge of scripting languages is a
requirement. Selecting which ones is a matter of discussion. My
take is this:
SQL: Not really a hard
data science language but reflects the fact that you’re likely to have to
extract data yourself from relational databases. Also, SQL is now almost
universally available as a query language on Hadoop (it’s really no longer accurate
to call it NoSQL).
Python: The big discussion
over the last five or so years has been around R versus Python. Python is
my pick as a production language with a very generous data science
library. More importantly, as SPARK has come on so quickly as the preferred
tool on Hadoop, Python works easily here while R does not. In the most
recent surveys you’ll see Python pulling away from R.
SAS: Yes SAS. SAS
was practically the original DS scripting language before R and Python.
Although it’s included here under programming skills you can learn to use the
SAS packages via drag-and-drop UI just as easily. Depending on what
survey you’re reading you
may or may not see SAS on each list, but in the Production world SAS is
extremely common and having this skill is a definite competitive
advantage. IBM SPSS is an option but SAS has a huge lead in
adoption. You will rarely encounter SAS in the Development world.
Phase III: Machine Learning
Participants
learn both supervised and unsupervised learning techniques. Supervised
learning techniques include decision trees, Random Forrest, logistic
regression, Neural Networks, and SVMs. Unsupervised learning techniques
include clustering, principal components analysis, and factor analysis.
Only a matter of a year or two ago you could not be an effective data
scientist without knowing the inner workings of these algorithms including how
to manipulate their tuning parameters to optimize results. The late
breaking news however is the new availability of completely automated
predictive analytic platformswhere selection and operation of the ML algorithms is handled by AI.
The
likelihood that your new employer will have any of these new platforms on hand
is still fairly slim but growing by the day. Perhaps you will be the one
to suggest they utilize them. They can really speed up the modeling
process. Until then, you need to know what’s going on under the hood of
all the major ML algorithms.
Phase IV: Big Data Toolbox
It is
important for data scientists to not only learn the necessary algorithms, but
also to learn how those algorithms need to be adapted for large datasets.
For this reason, basic knowledge of tools such as Hadoop, Spark, and an
analytics platform for large data sets constitutes a dedicated module.
It’s here
that you’ll learn how those models you built in the last section are put into
operation to assist business decisions. Until they’re operationalized,
they’re of no value.
It’s also
here that you’ll learn the basics of streaming versus batch both in model
development and implementation. Spark has come on very fast with
extremely high adoption rates and is the basic tool now for both batch and
streaming.
Should You Specialize Early?
In the
Development world you will increasingly only be selected if you have a
specialty. In the Production world you are likely to have more
opportunities if you don’t specialize. Having said that there are two
areas you may want to examine which can be picked up fairly rapidly and are
considered specializations within the Production world.
Supply Chain Forecasting: There are some very
specific techniques and
packages associated with true demand driven supply
chain forecasting that
can provide an unique entre in the world of manufacturing or logistics.
IoT for Manufacturing: This
is the use of predictive models on streaming data from SCADA systems and the
like to predict the quality of output during a production run or the imminent
failure of a piece of capital equipment.
If you
wanted to make your living in an area dominated by manufacturing you would
consider adding these to your portfolio early in your career.
For the most
part however, if you’re in the Production world, predictive modeling and
recommenders will be a complete toolset for several years.
Remember
also that our profession is changing fast. It is already well past the
time that a single data scientist could master the entire field.
Employers may still be looking for unicorns but very rapidly there will be
emerging specialty fields you may consider as your career progresses.
Deep learning, natural language processing, image processing, and AI are all
examples that will take either additional education or serious OJT.
What about
the rumors of those outsized salaries even for beginners? Well they are
at least partly true in that you will earn a well above average salary compared
to other analyst or IT staff positions. You’re not going get a Silicon
Valley salary if you’re working in Milwaukee.
The best salary and skills studies come from O’Reilly. Their most
recent survey for example says that a Master’s degree will only add about
$3,500 per year to your earnings. This is a well done
survey that
evaluates not only salary but time spent in different tasks, tools used, and
other factors. Be sure to carefully evaluate who filled out the surveys
and whether you think they are representative. There are no purely
objective bias-free surveys in our profession.
As Your Career Progresses

Data science has been and continues to be a field in which knowledge of
tools as well as business in paramount. We utilize a complex toolbox to
extract, blend, clean, transform, engineer, model, and implement models that
can create business value from data that only a few years ago was not
considered valuable.
It should
come as no surprise that innovation is simplifying and automating the toolbox
of existing tools even as new tools are arising. In the past if we were
expert carpenters with great skill with our tools, in the future we will be
more like architects bringing a broad range of tools and design skills to bear
to build value.
In
management consulting where I spent many years we used to say that a consultant
needs three legs to stand on, domain knowledge (knowledge of a particular
industry), process knowledge (deep understanding a particular process such as
planning, manufacturing, or accounting), and methodology (in management consulting
this means process improvement, reengineering, strategy development, or package
implementation among others). As your career progresses you should build
your own foundation on these three principles where methodology becomes the
skills of data science that you’ve mastered. The other two legs, deep
knowledge of one or more industries and one or more business processes will be
why future employers seek you out.
Abonner på:
Innlegg (Atom)